Difference between revisions of "Archive:England"
(condense lab1 journals) |
(condense lab2) |
||
| Line 884: | Line 884: | ||
== Lab 2: Holy Pigeon P#$! Batman, it's Penelope Poison! == | == Lab 2: Holy Pigeon P#$! Batman, it's Penelope Poison! == | ||
| − | + | ===England-2011-lab2-red=== | |
| − | + | Group 1: Ben Smith, Lily Cutler, Emily Van Cise, Albert Greene | |
| − | + | ==== Problem Description and Approach ==== | |
| + | For this lab we were given the task of locating various points identified in pictures provided to us. We were able to find the locations in the pictures though the use of a computer program that could read the embedded Longitude and Latitude in the images. At each location we were to take measurements of the following: ambient temperature, water temperature, wind speed and direction. We also needed to confirm the latitude, longitude, and altitude of the locations we visited. | ||
| + | |||
| + | ==== Data Collection ==== | ||
| + | To collect this information we used several methods, each with varying levels of accuracy. We used a Uni-T multimeter to measure ambient and water temperatures. The compass we were given gave us our orientation upon which we based wind direction. We dropped a leaf or watched Bill’s exhaled smoke. The Beaufort scale was used to determine the speed of the wind. We then used Google earth to check our latitude, longitude and altitude. | ||
| + | |||
| + | ==== Data Analysis ==== | ||
| + | |||
| + | Good news! Penelope Poison will likely not be successful in spreading poison because it is too cold and windy outside to allow the spread of the poison. | ||
| + | |||
| + | ==== Error Analysis ==== | ||
| + | |||
| + | '''Uni-T Device'''- The error in using this device is +/- 1% +3. Depending on how long we waited to receive the temperature reading there may have been some human error, also in how we recalibrated the device before taking the next reading. | ||
| + | |||
| + | '''Compass'''- The error of the compass was mainly human error based on how close to the actual location the compass was being held and the angle with which it was being held and the consistency to which it was held at this angle throughout the data collection. | ||
| + | |||
| + | '''Leaves'''- The error of using leaves to find out the direction of the wind is that not the same leaf was used every time and the wind speed of the locations may have varied based on the surroundings and landscape. If the leaves that we chose to drop in the wind were wet they may have been heavier and harder to blow and allowed for some error in the data for the wind direction. | ||
| + | |||
| + | '''Pictures'''- Our ability to mimic and recreate the pictures was flawed because of our inability to recognize the landmarks in the original pictures and our attempt to retake the photos. This was a human error. | ||
| + | |||
| + | ==== Images ==== | ||
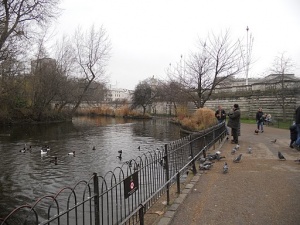
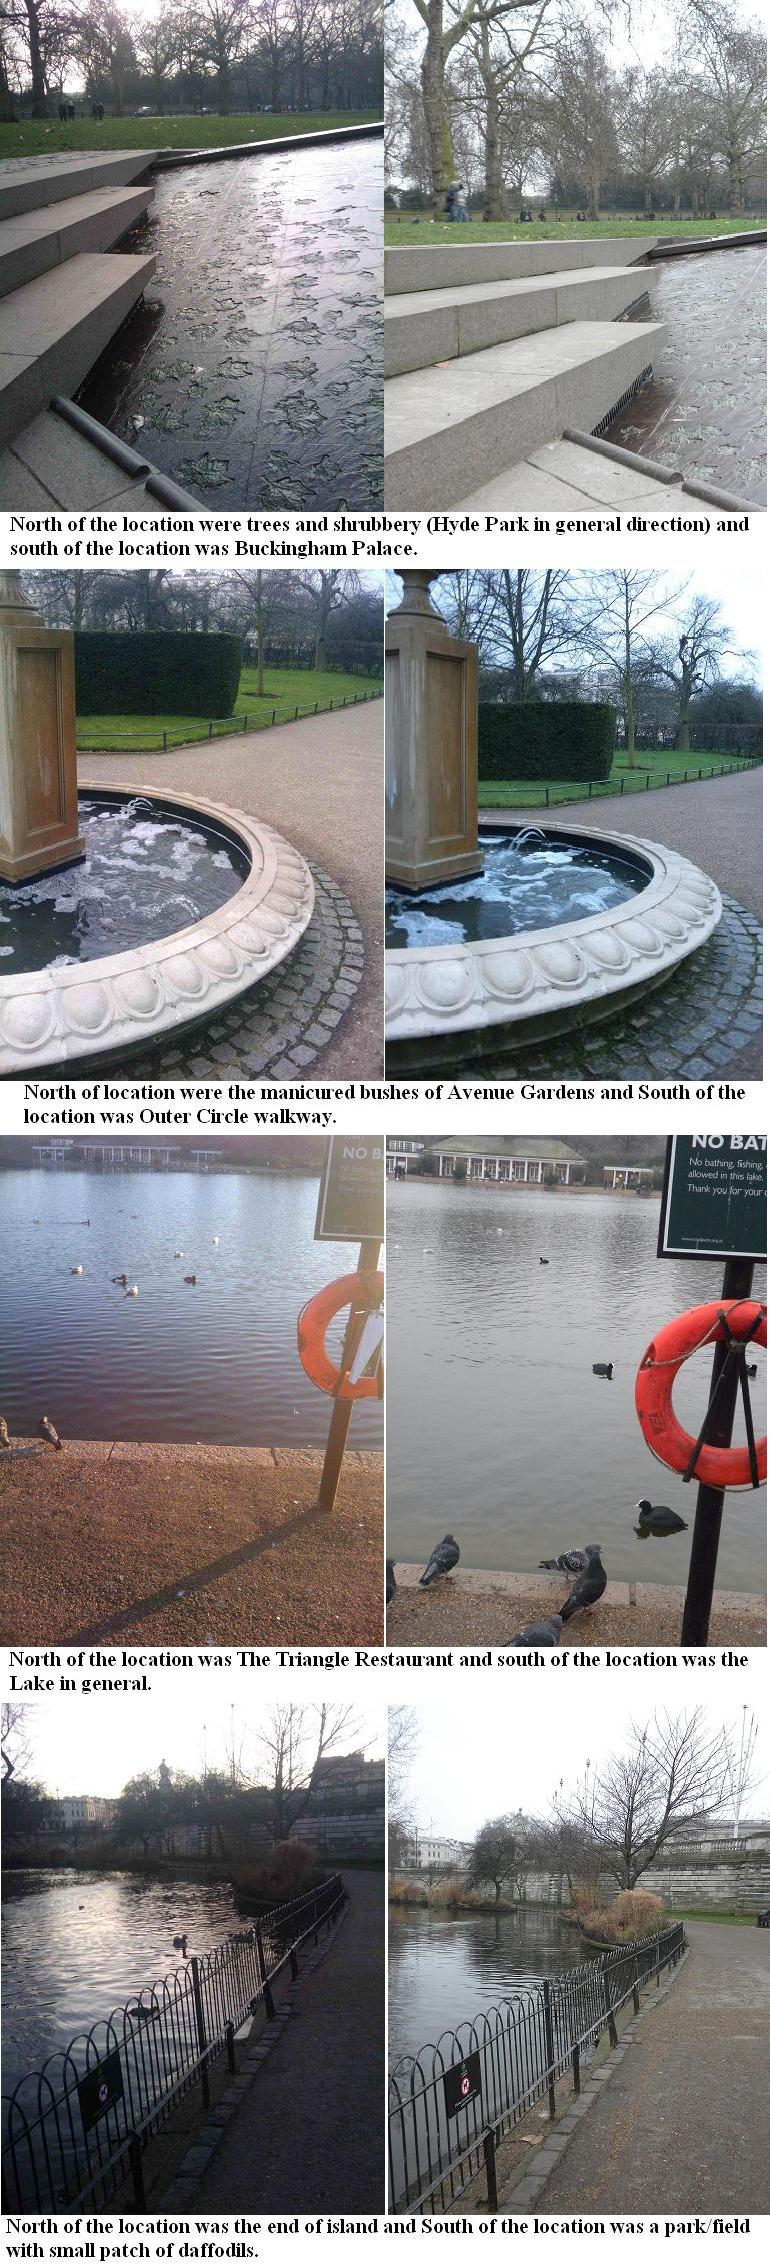
| + | [[Image:loc-a.jpg|thumb|Original]][[Image:loca.jpeg|thumb|looking S at canadian memorial]] | ||
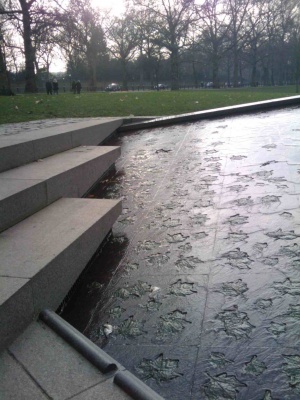
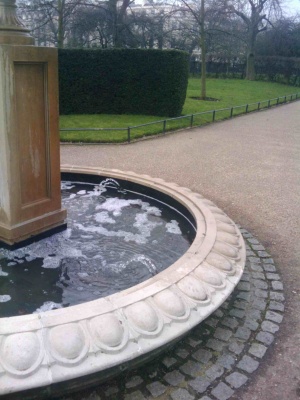
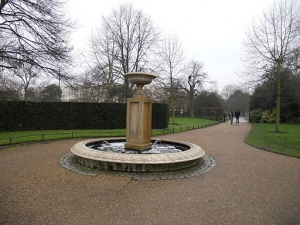
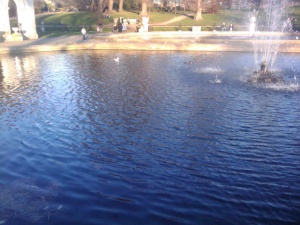
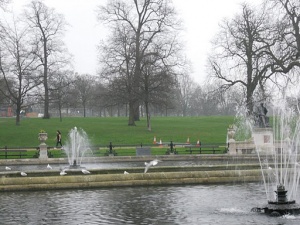
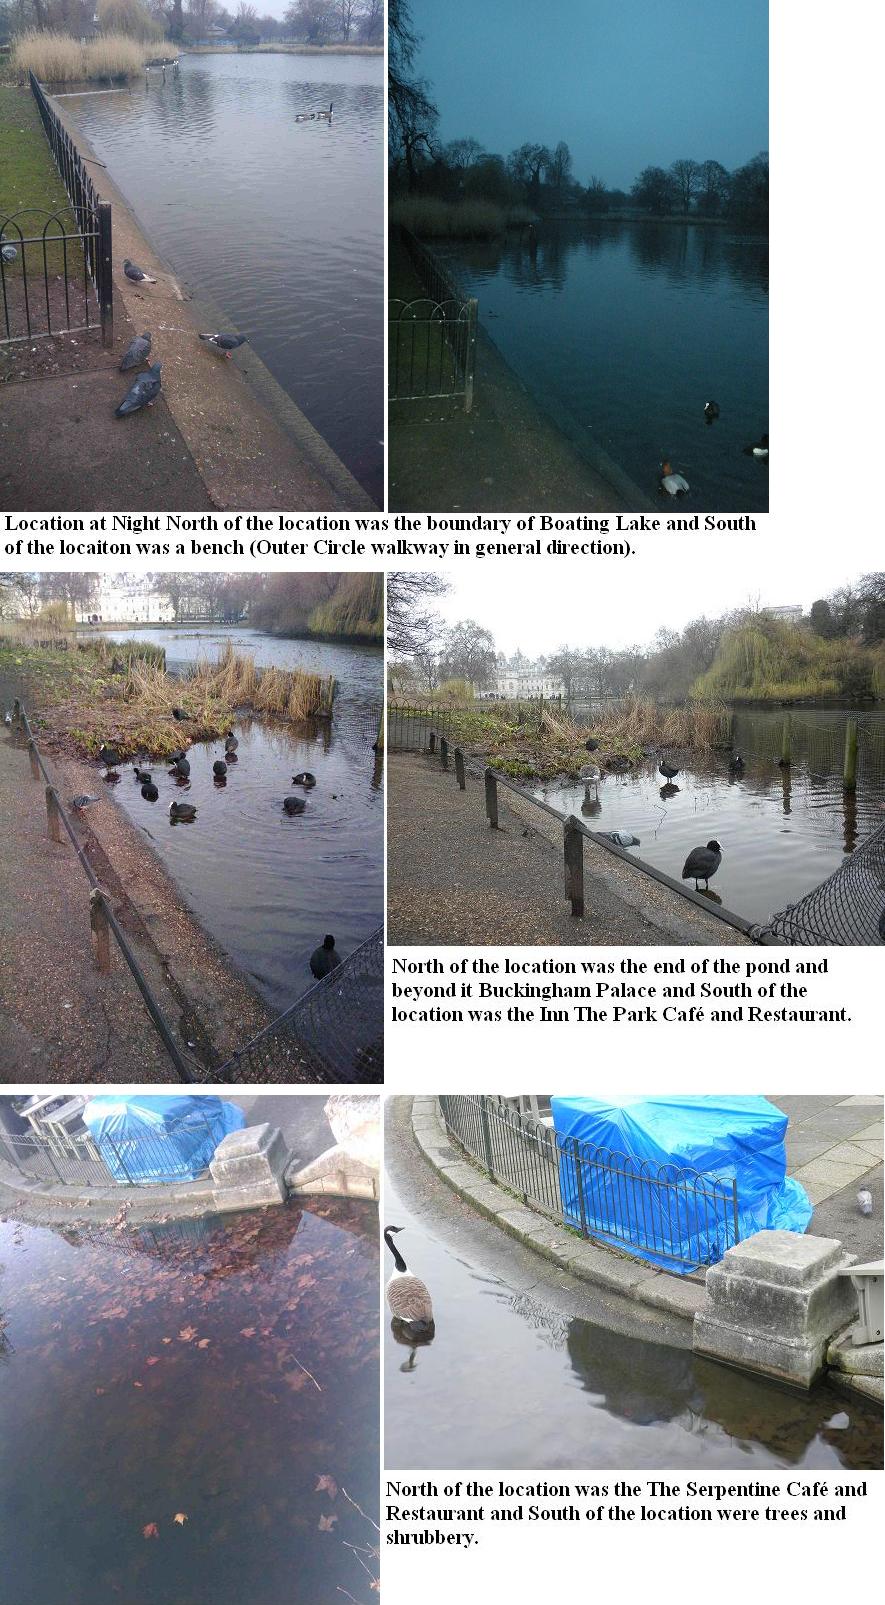
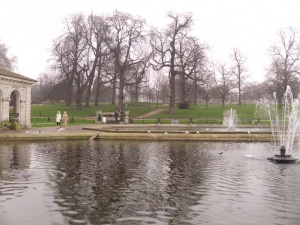
| + | [[Image:loc-b.jpg|thumb|Original]][[Image:locb.jpeg|thumb|looking SW over a fountain attached to Regents Park]] | ||
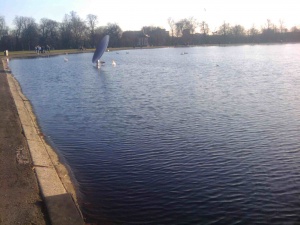
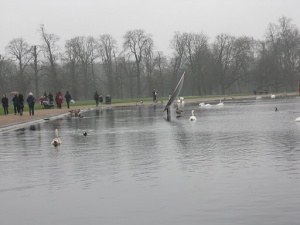
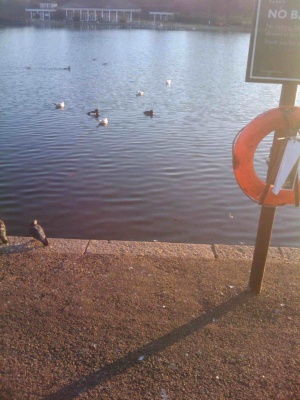
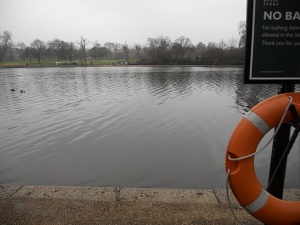
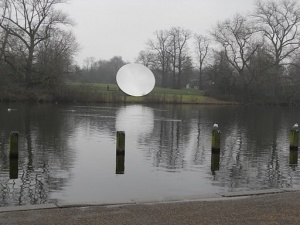
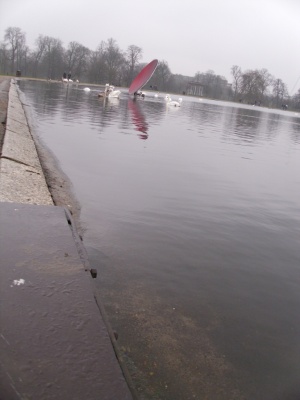
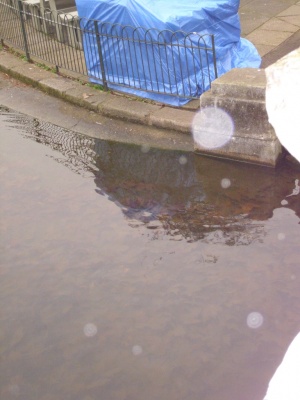
| + | [[Image:loc-c.jpg|thumb|Original]][[Image:locc.jpeg|thumb|looking S at the profile of the red reflector in Round Pond]] | ||
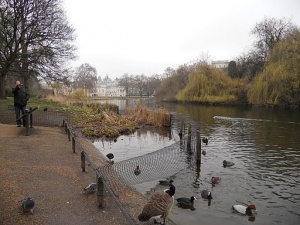
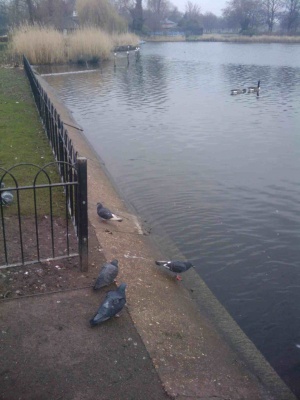
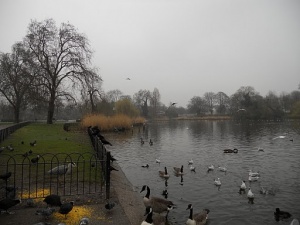
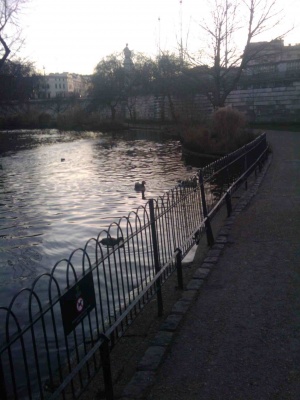
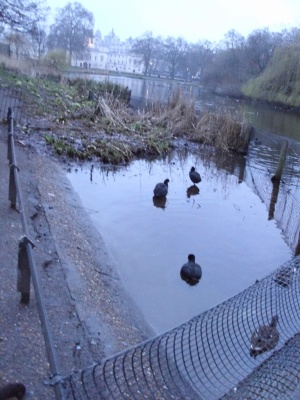
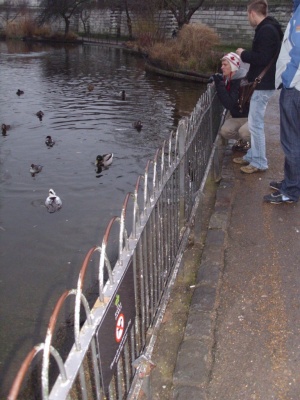
| + | [[Image:loc-d.jpg|thumb|Original]][[Image:locd.jpeg|thumb|looking SE at a duck pond]] | ||
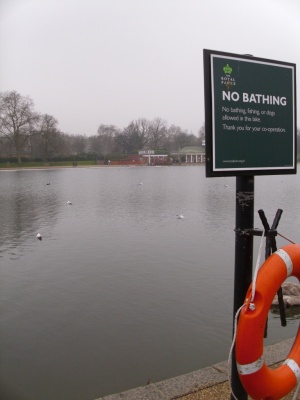
| + | [[Image:loc-e.jpg|thumb|Original]][[Image:loce.jpeg|thumb|Facing SW across Serpentine]] | ||
| + | [[Image:loc-f.jpg|thumb|Original]][[Image:locf.jpeg|thumb|Facing N looking across Regents Park Pond]] | ||
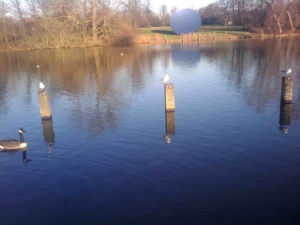
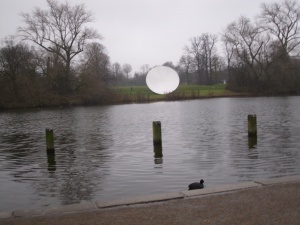
| + | [[Image:loc-g.jpg|thumb|Original]][[Image:locg.jpeg|thumb|Facing NE across Serpentine, looking at round reflector]] | ||
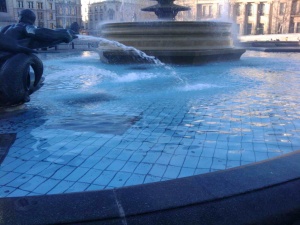
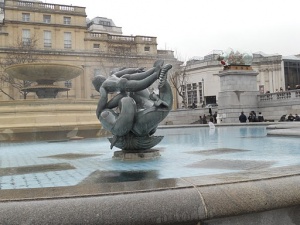
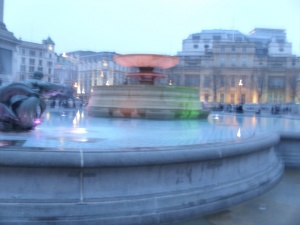
| + | [[Image:loc-h.jpg|thumb|Original]][[Image:loch.jpeg|thumb|SW at the southernmost fountain in Trafalger Sq]] | ||
| + | [[Image:loc-i.jpg|thumb|Original]][[Image:loci.jpeg|thumb|Facing NW, looking across the Serpentine]] | ||
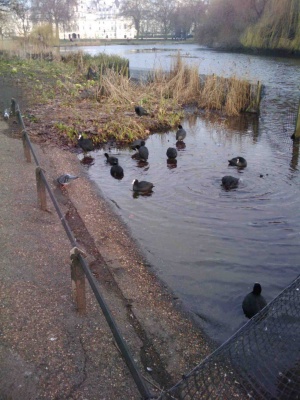
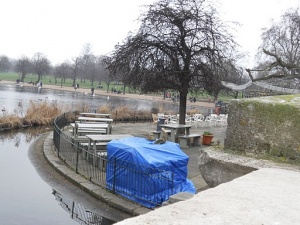
| + | [[Image:loc-j.jpg|thumb|Original]][[Image:locj.jpeg|thumb|S facing a small island, metal fence]] | ||
| + | [[Image:loc-k.jpg|thumb|Original]][[Image:lock.jpeg|thumb|Face E looking across the NW most pond]] | ||
| + | |||
| + | ==== Appendix A: Raw Data ==== | ||
| + | |||
| + | {| border="3" style="margin-left: 3em;" | ||
| + | |- | ||
| + | ! scope="col" | | ||
| + | ! scope="col" | Location A | ||
| + | ! scope="col" | Location B | ||
| + | ! scope="col" | Location C | ||
| + | ! scope="col" | Location D | ||
| + | ! scope="col" | Location E | ||
| + | ! scope="col" | Location F | ||
| + | ! scope="col" | Location G | ||
| + | ! scope="col" | Location H | ||
| + | ! scope="col" | Location I | ||
| + | ! scope="col" | Location J | ||
| + | ! scope="col" | Location K | ||
| + | |} | ||
| + | ! scope="row" | Longitude 1 | ||
| + | | -0.142664' | ||
| + | | -0.147532' | ||
| + | | -0.18197' | ||
| + | | -0.131919' | ||
| + | | -0.16976' | ||
| + | | -0.160808' | ||
| + | | -0.174759' | ||
| + | | -0.12766' | ||
| + | | -0.160074' | ||
| + | | -0.138764' | ||
| + | | -0.175849' | ||
| + | |} | ||
| + | ! scope="row" | Longitude 2 | ||
| + | | -0.142663' | ||
| + | | -0.147536' | ||
| + | | -0.181971' | ||
| + | | -0.131941' | ||
| + | | -0.169744' | ||
| + | | -0.160836' | ||
| + | | -0.174752' | ||
| + | | -0.127667' | ||
| + | | -0.160078' | ||
| + | | -0.138727' | ||
| + | | -0.175881' | ||
| + | |} | ||
| + | ! scope="row" | Longitude 3 | ||
| + | | -0.142663' | ||
| + | | -0.147537' | ||
| + | | -0.181972' | ||
| + | | -0.131955' | ||
| + | | -0.169737' | ||
| + | | -0.160836' | ||
| + | | -0.174743' | ||
| + | | -0.127649' | ||
| + | | -0.160064' | ||
| + | | -0.138728' | ||
| + | | -0.175883' | ||
| + | |} | ||
| + | ! scope="row" | Latitude 1 | ||
| + | | 51.50286' | ||
| + | | 51.52532' | ||
| + | | 51.506391' | ||
| + | | 51.503448' | ||
| + | | 51.505966' | ||
| + | | 51.527818' | ||
| + | | 51.507294' | ||
| + | | 51.508194' | ||
| + | | 51.504419' | ||
| + | | 51.501745' | ||
| + | | 51.516659' | ||
| + | |} | ||
| + | ! scope="row" | Latitude 2 | ||
| + | | 51.502863' | ||
| + | | 51.525323' | ||
| + | | 51.506392' | ||
| + | | 51.503456' | ||
| + | | 51.505966' | ||
| + | | 51.527759' | ||
| + | | 51.507298' | ||
| + | | 51.508199' | ||
| + | | 51.504413' | ||
| + | | 51.501745' | ||
| + | | 51.510665' | ||
| + | |} | ||
| + | ! scope="row" | Latitude 3 | ||
| + | | 51.502862' | ||
| + | | 51.525328' | ||
| + | | 51.50639' | ||
| + | | 51.503453' | ||
| + | | 51.505954' | ||
| + | | 51.527769' | ||
| + | | 51.507292' | ||
| + | | 51.508205' | ||
| + | | 51.50443' | ||
| + | | 51.501754' | ||
| + | | 51.510668' | ||
| + | |} | ||
| + | ! scope="row" | Altitude 1 | ||
| + | | 41 ft | ||
| + | | 105 ft | ||
| + | | 97 ft | ||
| + | | 36 ft | ||
| + | | 50 ft | ||
| + | | 122 ft | ||
| + | | 70 ft | ||
| + | | 69 ft | ||
| + | | 52 ft | ||
| + | | | ||
| + | | 75 ft | ||
| + | |} | ||
| + | |! scope="row" | Altitude 2 | ||
| + | | 41 ft | ||
| + | | 105 ft | ||
| + | | 97 ft | ||
| + | | 36 ft | ||
| + | | 50 ft | ||
| + | | 122 ft | ||
| + | | 70 ft | ||
| + | | 68 ft | ||
| + | | 52 ft | ||
| + | | | ||
| + | | 75 ft | ||
| + | |} | ||
| + | |! scope="row" | Altitude 2 | ||
| + | | 41 ft | ||
| + | | 105 ft | ||
| + | | 97 ft | ||
| + | | 36 ft | ||
| + | | 50 ft | ||
| + | | 122 ft | ||
| + | | 70 ft | ||
| + | | 69 ft | ||
| + | | 52 ft | ||
| + | | | ||
| + | | 75 ft | ||
| + | |} | ||
| + | |||
| + | |||
| + | |||
| + | |||
| + | |||
| + | {| border="3" style="margin-left: 3em;" | ||
| + | |- | ||
| + | ! scope="col" | | ||
| + | ! scope="col" | Location A | ||
| + | ! scope="col" | Location B | ||
| + | ! scope="col" | Location C | ||
| + | ! scope="col" | Location D | ||
| + | ! scope="col" | Location E | ||
| + | ! scope="col" | Location F | ||
| + | ! scope="col" | Location G | ||
| + | ! scope="col" | Location H | ||
| + | ! scope="col" | Location I | ||
| + | ! scope="col" | Location J | ||
| + | ! scope="col" | Location K | ||
| + | |- | ||
| + | ! scope="row" | Time Stamp | ||
| + | | 12:03 | ||
| + | | 02:32 | ||
| + | | 3:30 | ||
| + | | 11:45 | ||
| + | | 12:52 | ||
| + | | 02:11 | ||
| + | | 03:08 | ||
| + | | 03:20 | ||
| + | | 12:28 | ||
| + | | 11:54 | ||
| + | | 02:59 | ||
| + | |- | ||
| + | ! scope="row" | Water Temperature1 | ||
| + | | 7 | ||
| + | | 6 | ||
| + | | 5 | ||
| + | | 6 | ||
| + | | 3 | ||
| + | | 3 | ||
| + | | 3 | ||
| + | | 8 | ||
| + | | 4 | ||
| + | | 6 | ||
| + | | 3 | ||
| + | |- | ||
| + | ! scope="row" | Water Temperature 2 | ||
| + | | 8 | ||
| + | | 6 | ||
| + | | 5 | ||
| + | | 7 | ||
| + | | 3 | ||
| + | | 3 | ||
| + | | 4 | ||
| + | | 8 | ||
| + | | 5 | ||
| + | | 6 | ||
| + | | 3 | ||
| + | |- | ||
| + | ! scope="row" | Water Temperature 3 | ||
| + | | 8 | ||
| + | | 6 | ||
| + | | 6 | ||
| + | | 7 | ||
| + | | 3 | ||
| + | | 3 | ||
| + | | 4 | ||
| + | | 8 | ||
| + | | 4 | ||
| + | | 6 | ||
| + | | 3 | ||
| + | |- | ||
| + | ! scope="row" | Ambient Temperature 1 | ||
| + | | 6 | ||
| + | | 4 | ||
| + | | 2 | ||
| + | | 7 | ||
| + | | 5 | ||
| + | | 2 | ||
| + | | 2 | ||
| + | | 11 | ||
| + | | 7 | ||
| + | | 7 | ||
| + | | 3 | ||
| + | |- | ||
| + | ! scope="row" | Ambient Temperature 2 | ||
| + | | 7 | ||
| + | | 5 | ||
| + | | 3 | ||
| + | | 8 | ||
| + | | 4 | ||
| + | | 3 | ||
| + | | 3 | ||
| + | | 10 | ||
| + | | 9 | ||
| + | | 8 | ||
| + | | 3 | ||
| + | |- | ||
| + | ! scope="row" | Ambient Temperature 3 | ||
| + | | 7 | ||
| + | | 4 | ||
| + | | 2 | ||
| + | | 8 | ||
| + | | 5 | ||
| + | | 3 | ||
| + | | 2 | ||
| + | | 9 | ||
| + | | 8 | ||
| + | | 8 | ||
| + | | 3 | ||
| + | |- | ||
| + | |||
| + | ====Appendix B: Visualization==== | ||
| + | [[Image:charts.pdf]] Our Charts | ||
| + | |||
| + | [[Image:chartdata.pdf]] The data behind the charts | ||
| + | |||
| + | Charlie, i know you want these embedded, but i cannot figure out how... I think it has something to do with the file type? | ||
| + | |||
| + | ==== Appendix C: Who Did What ==== | ||
| + | Bill: For this lab, I was the official temperature taker, reading off the ambient and water temperatures. I also played a role in writing the lab report, taking care of part one, two and my section in part nine. I also found the Latitude, Longitude and altitude for the data spread sheet. | ||
| + | |||
| + | Emily: For this lab, I took the pictures and did the copy-editing. I posted the images and the raw data tables. | ||
| + | |||
| + | Ben: I downloaded the pictures, figured out how to read / import the geo-coding into Google earth. Looked at the location and planned our route. Built a spread to sheet to make data entry easier, entered data. Helped navigate and kept us somewhat found. Did visualization. | ||
| + | |||
| + | Lily: For this lab, I took the wind directions and the directions that we were facing. I also did the write up of the error analysis. | ||
| + | |||
| + | === England-2011-lab2-yellow === | ||
| + | |||
| + | <span style="color:#000000; background:#FFFF00">'''Mamus, Vivian, Eva & Ivan''' </span> <br> | ||
| + | We just have to do a short write up for the visualization part. | ||
| + | Even without it, it is very clear to understand :) | ||
| + | |||
| + | ==== <span style="color:#FF0000"> '''Problem Description and Approach''' </span> ==== | ||
| + | Our task as the Yellow Team was to collect data from various water bodies in order to gauge the possible effects of releasing a toxic substance into London’s water supply. Dr. Obfuscation only provided photographs of the 11 locations where Penelope Poison threatened to release these toxic substances. We needed to figure out the geographical coordinates (latitude and longitude) of these locations, measure the air and water temperature, our elevation and note the wind speed plus direction at the times we were at these locations. Most importantly, we needed to figure out what the most accurate approach to collecting this data was, and what if any flaws there were in collecting this data. Time was also a factor to keep in mind, so we decided to tackle the location not in alphabetical order, but in the order of their proximity to one another. | ||
| + | |||
| + | ==== <span style="color:#FF0000"> ''' Data Collection''' </span> ==== | ||
| + | |||
| + | |||
| + | '''Latitude, Longitude and Elevation using an eTrex GPS navigator ''' | ||
| + | |||
| + | In order to determine the latitude, longitude and the elevation we used a GPS navigator powered by AA batteries. After turning the device on, three minutes were allowed to pass before readings were taken from the device for the first time in order to give it enough time to recognize enough satellites in order to provide accurate readings. For the second reading, the GPS device was turned off and on again, with a two minute interval before announcing the readings on the screen. For the third reading, the same procedure was followed except an interval of one minute was allowed before recording the readings produced by the device. | ||
| + | |||
| + | |||
| + | '''Wind direction using a compass and Tesco plastic bag''' | ||
| + | |||
| + | We laid the compass on a flat surface ( someone's palm, on the ground, on the surface of a flat bench) to help us determine the direction (north, west, east and south) of the location of the water body,. Three of the group members would each stand parallel to the compass with the plastic bag on their hand and observe the direction of the wind. | ||
| + | |||
| + | |||
| + | '''Wind speed using the Beaufort Scale''' | ||
| + | |||
| + | Wind speed was collected using the Beaufort Scale, a standardized method using visual estimations of the effect of the wind on objects such as a Tesco plastic bag, body of water and tees. When using the plastic bag, it was important to make sure that it was completely unfolded and had no residue of any sort inside it. It was held on at an arms length for 30 seconds. The extent of movement by the plastic bag was then visualized against the description of the Beaufort and awarded a number that matched the images of water used on the wikipedia page to distinguish between different wind speeds. When observing the water, it was important to make sure that the observer watcher its surface for at least one minute in order to establish a steady rate of motion on the surface of the water as a result of the wind. Lastly, when observing the trees, it was important to watch one specific tree for one minute in order to establish the effect of the speed of the wind on the leaves. This was done at every location. | ||
| + | |||
| + | |||
| + | '''Air and Water Temperature using the Maplin thermocouple thermometer''' | ||
| + | |||
| + | In order to measure the temperature for the air and water we used the Maplin thermocoupla thermometer device provided to us by Charlie Peck. This device consists of a screen for taking readings, an on and off button, a hold button, and a small metal rod attached to a wire on the back of the device for taking temperature measurements. At each location we went to we took out the rod, turned on the device, left it on for two minutes and then took the reading, copied the temperature reading onto our data sheet, then turned off the device for one minute and repeated this process twice more copying the respective readings onto our notes. Then using the same tool we put the small rod into the water at each location, here it was important to make sure the rod was immersed significantly in the water, we left the rod for two minutes, removed it from the water and copied the temperature from the screen. We then dried off the rod waited one minute and repeated this process twice. | ||
| + | |||
| + | |||
| + | '''Finding places''' | ||
| + | |||
| + | Nowadays there is more data stored in a single photo than can be seen in the photo itself. Information including when the photo was taken and with what equipment the photo was taken is available in data stored within pictures. Some cameras even have GPS devices incorporated into their mechanics allowing them to store the coordinates of the location at which the photo was taken (geocoding). The pictures provided by Dr. Obfuscation contained information which contained coordinates which could be read and further integrated into satellite images on Google Earth using Picasa. | ||
| + | |||
| + | The picture below demonstrate the integration of the photos provided by Dr. Obfuscation and Google Earth, which enabled us to tactfully choose which locations to record date from first. | ||
| + | [[Image:Places.jpg]] | ||
| + | |||
| + | ==== <span style="color:#FF0000"> ''' Error Analysis''' </span> ==== | ||
| + | |||
| + | '''Latitude, Longitude and Elevation''' | ||
| + | |||
| + | We checked on the Garmin website, the Etrex Vista C, is accurate within 30 meters and 95% of the time. Its accuracy and errors also largely depends on how many satellites it can find. | ||
| + | |||
| + | |||
| + | '''Wind Direction using a compass and Tesco plastic bag''' | ||
| + | |||
| + | It was hard having the compass on a flat surface in some areas as most readings were taken while it was on someone's palm ( a surface that is not even). In addition, regular compasses are not made to point exact North, but relative North which a point with a particularly strong magnetic pull. Therefore many of the objects we identified as being North or South of the water bodies might not have been so, if we were looking for a precise bearings. | ||
| + | When experiencing light winds, a Tesco plastic bag might prove to be denser than the wind thus making it impossible to show which direction the wind is moving. Using objects that have a similar density to air, such as dyed smoke or cigarette smoke might be more efficient in showing much lighter winds. | ||
| + | |||
| + | |||
| + | |||
| + | '''Wind Speed using the Beaufort Scale''' | ||
| + | |||
| + | The primary error with using the Beaufort scale to measure wind speed is that every humans capacity to estimate the similarity of the effect of wind on an object that is not water (as was originally the case) is that everyone perception is different. When using the plastic bag,a source of era was its density. At times, when the force of wind speed was lesser than the density of the plastic bag, it failed to move this leading to the observatoon that there was no wind when in actual fact there might have been some movement at extremely low speeds. Secondly, when using the water as a means to estimate the wine speed, our method did not account for movement caused by other objects such as animals in the water body or man made objects such as paddle boats. This may have indicated that the wind speed was greater than was the actual case. Lastly with using the trees, a primary source of error was due to the season where most of the leaves haveel fallen out. Similar to the plastic bag, some winds might be too slow to cause movements among the branches of the tree- once again resulting in estimating wind speeds that might be slower than is the actual case. | ||
| + | |||
| + | |||
| + | '''Air and Water Temperature using the Maplin thermocouple thermometer | ||
| + | |||
| + | Sources of error that we experienced in collecting air and water temperature were both mechanical and human errors. Although we dried the rod after each reading the rod may still have been chilled which may have affected the results of the next air temperature reading. As far as documenting water temperatures we experienced problems with accuracy due to an inability in some locations to immerse the rod without it being in contact with stone. Also the varying depth of the bodies of water may have had some effect on the accuracy of the readings. In the manual of this device it is written that its error is +- 3%. | ||
| + | |||
| + | |||
| + | ==== <span style="color:#FF0000"> ''' Images ''' </span> ==== | ||
| + | |||
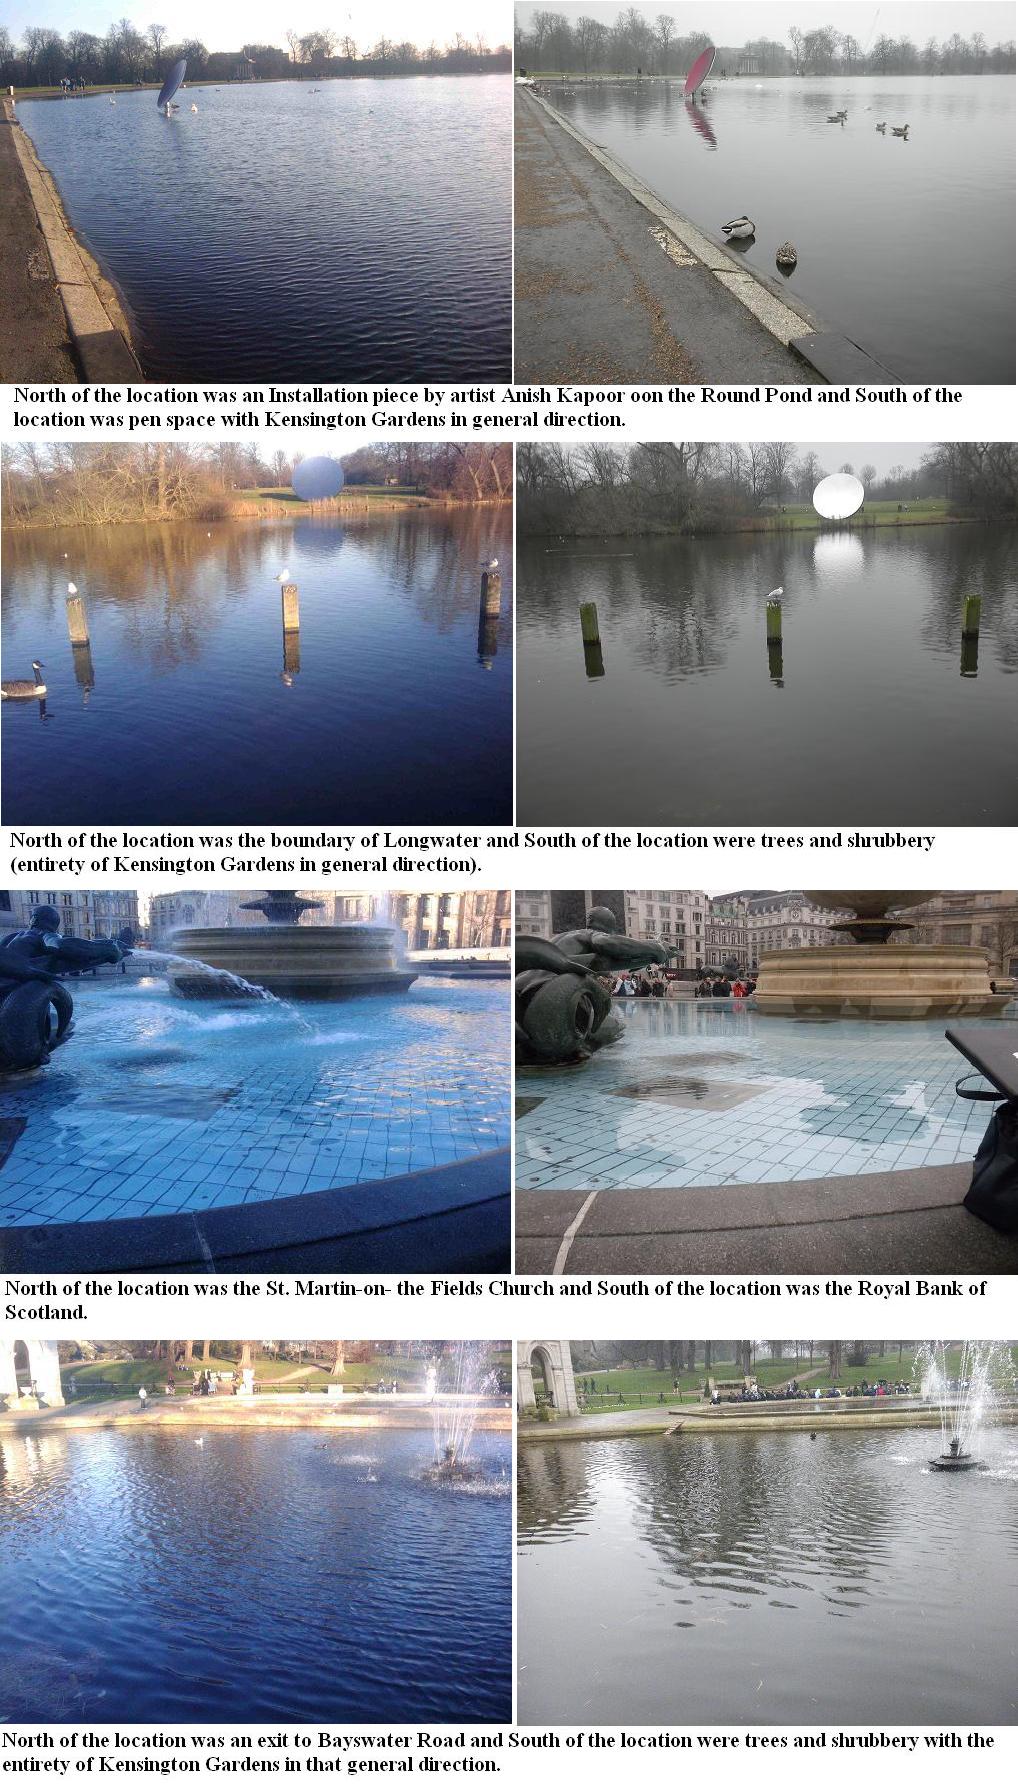
| + | Left photos are the one that we were given. And the photos that are on the right side are out reproduction of each and single photo. Under every set of photos there is a nice description about what is around. This is the order of them: c, g, h, k, a, b, e, j, f, d, i. | ||
| + | |||
| + | |||
| + | [[Image:C,g,h,j.jpg]] | ||
| + | |||
| + | |||
| + | [[Image:A,b,e,j.jpg]] | ||
| + | |||
| + | |||
| + | [[Image:D,i,f.jpg]] | ||
| + | |||
| + | |||
| + | In addition, below is a link that will take you to the premier showing of the Yellow Team's first production (in the form of a slide show) of Holy Pigeon P#$@ Batman, it's Penelope Poison!. Accompanying each picture is a caption including what is North and South of the water body. | ||
| + | |||
| + | https://picasaweb.google.com/nataosim/HolyPigeonPBatmanItSPenelopePoisonYellowTeam?authkey=Gv1sRgCMS2nNGZ7anycQ# | ||
| + | |||
| + | |||
| + | ==== <span style="color:#FF0000"> ''' Appendix A: Raw Data & Data Analysis''' </span> ==== | ||
| + | |||
| + | {|border="1" cellpadding="5" cellspacing="0" align="left" | ||
| + | |- | ||
| + | ! scope="col" style="background:#efefef;" | Location: | ||
| + | ! scope="col" style="background:#efefef;" | Time | ||
| + | ! scope="col" style="background:#efefef;" | GPS Elevation | ||
| + | ! scope="col" style="background:#efefef;" | Air Temp | ||
| + | ! scope="col" style="background:#efefef;" | Water Temp | ||
| + | ! scope="col" style="background:#efefef;" | Wind Direction | ||
| + | ! scope="col" style="background:#efefef;" | Wind Speed | ||
| + | ! scope="col" style="background:#efefef;" | Latitude | ||
| + | ! scope="col" style="background:#efefef;" | Longitude | ||
| + | |- | ||
| + | !scope="col" style="background:#efefef;" | H | ||
| + | |11:35 | ||
| + | |59 ft | ||
| + | |8 °C | ||
| + | |7 °C | ||
| + | |SE | ||
| + | |~1 | ||
| + | |51.50813° | ||
| + | |000.12798° | ||
| + | |- | ||
| + | !scope="col" style="background:#efefef;" | H | ||
| + | | | ||
| + | |49 ft | ||
| + | |7 °C | ||
| + | |7 °C | ||
| + | | | ||
| + | | | ||
| + | |51.50803° | ||
| + | |000.12762° | ||
| + | |- | ||
| + | !scope="col" style="background:#efefef;" | H | ||
| + | | | ||
| + | |55 ft | ||
| + | |10 °C | ||
| + | |7 °C | ||
| + | | | ||
| + | | | ||
| + | |51.50821° | ||
| + | |000.12753° | ||
| + | |- | ||
| + | !scope="col" style="background:#efefef;" | H average | ||
| + | !scope="col" style="background:#80000; color:#FFFFFF;" | 11:35 | ||
| + | !scope="col" style="background:#80000; color:#FFFFFF;" | 54.3 ft | ||
| + | !scope="col" style="background:#80000; color:#FFFFFF;" | 8.3 °C | ||
| + | !scope="col" style="background:#80000; color:#FFFFFF;" | 7.0 °C | ||
| + | !scope="col" style="background:#80000; color:#FFFFFF;" | SE | ||
| + | !scope="col" style="background:#80000; color:#FFFFFF;" | ~1 | ||
| + | !scope="col" style="background:#80000; color:#FFFFFF;" | 51.50812° | ||
| + | !scope="col" style="background:#80000; color:#FFFFFF;" | 000.12771° | ||
| + | |- | ||
| + | !scope="col" style="background: black" | | ||
| + | !scope="col" style="background: black" | | ||
| + | !scope="col" style="background: black" | | ||
| + | !scope="col" style="background: black" | | ||
| + | !scope="col" style="background: black" | | ||
| + | !scope="col" style="background: black" | | ||
| + | !scope="col" style="background: black" | | ||
| + | !scope="col" style="background: black" | | ||
| + | !scope="col" style="background: black" | | ||
| + | |- | ||
| + | !scope="col" style="background:#efefef;" | D | ||
| + | |12:06 | ||
| + | |31 ft | ||
| + | |11 °C | ||
| + | |5 °C | ||
| + | |S | ||
| + | |~1 | ||
| + | |51.50359° | ||
| + | |000.13118° | ||
| + | |- | ||
| + | !scope="col" style="background:#efefef;" | D | ||
| + | | | ||
| + | |36 ft | ||
| + | |10 °C | ||
| + | |5 °C | ||
| + | | | ||
| + | | | ||
| + | |51.50357° | ||
| + | |000.13223° | ||
| + | |- | ||
| + | !scope="col" style="background:#efefef;" | D | ||
| + | | | ||
| + | |49 ft | ||
| + | |5 °C | ||
| + | |5 °C | ||
| + | | | ||
| + | | | ||
| + | |51.50371° | ||
| + | |000.13227° | ||
| + | |- | ||
| + | !scope="col" style="background:#efefef;" | D average | ||
| + | !scope="col" style="background:#80000; color:#FFFFFF;" | 12:06 | ||
| + | !scope="col" style="background:#80000; color:#FFFFFF;" | 38.6 ft | ||
| + | !scope="col" style="background:#80000; color:#FFFFFF;" | 8.6 °C | ||
| + | !scope="col" style="background:#80000; color:#FFFFFF;" | 5.0 °C | ||
| + | !scope="col" style="background:#80000; color:#FFFFFF;" | S | ||
| + | !scope="col" style="background:#80000; color:#FFFFFF;" | ~1 | ||
| + | !scope="col" style="background:#80000; color:#FFFFFF;" | 51.50366° | ||
| + | !scope="col" style="background:#80000; color:#FFFFFF;" | 000.13189° | ||
| + | |- | ||
| + | !scope="col" style="background: black" | | ||
| + | !scope="col" style="background: black" | | ||
| + | !scope="col" style="background: black" | | ||
| + | !scope="col" style="background: black" | | ||
| + | !scope="col" style="background: black" | | ||
| + | !scope="col" style="background: black" | | ||
| + | !scope="col" style="background: black" | | ||
| + | !scope="col" style="background: black" | | ||
| + | !scope="col" style="background: black" | | ||
| + | |- | ||
| + | !scope="col" style="background:#efefef;" | J | ||
| + | |12:25 | ||
| + | |36 ft | ||
| + | |7 °C | ||
| + | |5 °C | ||
| + | |S | ||
| + | |~1 | ||
| + | |51.50191° | ||
| + | |000.13934° | ||
| + | |- | ||
| + | !scope="col" style="background:#efefef;" | J | ||
| + | | | ||
| + | |39 ft | ||
| + | |6 °C | ||
| + | |5 °C | ||
| + | | | ||
| + | | | ||
| + | |51.50209° | ||
| + | |000.13946° | ||
| + | |- | ||
| + | !scope="col" style="background:#efefef;" | J | ||
| + | | | ||
| + | |30 ft | ||
| + | |6 °C | ||
| + | |5 °C | ||
| + | | | ||
| + | | | ||
| + | |51.50178° | ||
| + | |000.13988° | ||
| + | |- | ||
| + | !scope="col" style="background:#efefef;" | J average | ||
| + | !scope="col" style="background:#80000; color:#FFFFFF;" | 12:25 | ||
| + | !scope="col" style="background:#80000; color:#FFFFFF;" | 35.0 ft | ||
| + | !scope="col" style="background:#80000; color:#FFFFFF;" | 6.3 °C | ||
| + | !scope="col" style="background:#80000; color:#FFFFFF;" | 5.6 °C | ||
| + | !scope="col" style="background:#80000; color:#FFFFFF;" | S | ||
| + | !scope="col" style="background:#80000; color:#FFFFFF;" | ~1 | ||
| + | !scope="col" style="background:#80000; color:#FFFFFF;" | 51.50192° | ||
| + | !scope="col" style="background:#80000; color:#FFFFFF;" | 000.13956° | ||
| + | |- | ||
| + | !scope="col" style="background: black" | | ||
| + | !scope="col" style="background: black" | | ||
| + | !scope="col" style="background: black" | | ||
| + | !scope="col" style="background: black" | | ||
| + | !scope="col" style="background: black" | | ||
| + | !scope="col" style="background: black" | | ||
| + | !scope="col" style="background: black" | | ||
| + | !scope="col" style="background: black" | | ||
| + | !scope="col" style="background: black" | | ||
| + | |- | ||
| + | !scope="col" style="background:#efefef;" | A | ||
| + | |12:42 | ||
| + | |36 ft | ||
| + | |7 °C | ||
| + | |6 °C | ||
| + | |SW | ||
| + | |~1 | ||
| + | |51.50290° | ||
| + | |000.14225° | ||
| + | |- | ||
| + | !scope="col" style="background:#efefef;" | A | ||
| + | | | ||
| + | |31 ft | ||
| + | |7 °C | ||
| + | |6 °C | ||
| + | | | ||
| + | | | ||
| + | |51.50292° | ||
| + | |000.14247° | ||
| + | |- | ||
| + | !scope="col" style="background:#efefef;" | A | ||
| + | | | ||
| + | |30 ft | ||
| + | |7 °C | ||
| + | |6 °C | ||
| + | | | ||
| + | | | ||
| + | |51.50288° | ||
| + | |000.14288° | ||
| + | |- | ||
| + | !scope="col" style="background:#efefef;" | A average | ||
| + | !scope="col" style="background:#80000; color:#FFFFFF;" | 12:42 | ||
| + | !scope="col" style="background:#80000; color:#FFFFFF;" | 32.3 ft | ||
| + | !scope="col" style="background:#80000; color:#FFFFFF;" | 7.0 °C | ||
| + | !scope="col" style="background:#80000; color:#FFFFFF;" | 6.0 °C | ||
| + | !scope="col" style="background:#80000; color:#FFFFFF;" | SW | ||
| + | !scope="col" style="background:#80000; color:#FFFFFF;" | ~1 | ||
| + | !scope="col" style="background:#80000; color:#FFFFFF;" | 51.50290° | ||
| + | !scope="col" style="background:#80000; color:#FFFFFF;" | 000.14253° | ||
| + | |- | ||
| + | !scope="col" style="background: black" | | ||
| + | !scope="col" style="background: black" | | ||
| + | !scope="col" style="background: black" | | ||
| + | !scope="col" style="background: black" | | ||
| + | !scope="col" style="background: black" | | ||
| + | !scope="col" style="background: black" | | ||
| + | !scope="col" style="background: black" | | ||
| + | !scope="col" style="background: black" | | ||
| + | !scope="col" style="background: black" | | ||
| + | |- | ||
| + | !scope="col" style="background:#efefef;" | I | ||
| + | |13:25 | ||
| + | |42 ft | ||
| + | |6 °C | ||
| + | |5 °C | ||
| + | |SW | ||
| + | |~1 | ||
| + | |51.50446° | ||
| + | |000.16004° | ||
| + | |- | ||
| + | !scope="col" style="background:#efefef;" | I | ||
| + | | | ||
| + | |50 ft | ||
| + | |6 °C | ||
| + | |5 °C | ||
| + | | | ||
| + | | | ||
| + | |51.50443° | ||
| + | |000.16006° | ||
| + | |- | ||
| + | !scope="col" style="background:#efefef;" | I | ||
| + | | | ||
| + | |45 ft | ||
| + | |6 °C | ||
| + | |5 °C | ||
| + | | | ||
| + | | | ||
| + | |51.50443° | ||
| + | |000.16007° | ||
| + | |- | ||
| + | !scope="col" style="background:#efefef;" | I average | ||
| + | !scope="col" style="background:#80000; color:#FFFFFF;" | 13:25 | ||
| + | !scope="col" style="background:#80000; color:#FFFFFF;" | 45.6 ft | ||
| + | !scope="col" style="background:#80000; color:#FFFFFF;" | 6.0 °C | ||
| + | !scope="col" style="background:#80000; color:#FFFFFF;" | 5.0 °C | ||
| + | !scope="col" style="background:#80000; color:#FFFFFF;" | SW | ||
| + | !scope="col" style="background:#80000; color:#FFFFFF;" | ~1 | ||
| + | !scope="col" style="background:#80000; color:#FFFFFF;" | 51.50444° | ||
| + | !scope="col" style="background:#80000; color:#FFFFFF;" | 000.16005° | ||
| + | |- | ||
| + | !scope="col" style="background: black" | | ||
| + | !scope="col" style="background: black" | | ||
| + | !scope="col" style="background: black" | | ||
| + | !scope="col" style="background: black" | | ||
| + | !scope="col" style="background: black" | | ||
| + | !scope="col" style="background: black" | | ||
| + | !scope="col" style="background: black" | | ||
| + | !scope="col" style="background: black" | | ||
| + | !scope="col" style="background: black" | | ||
| + | |- | ||
| + | !scope="col" style="background:#efefef;" | E | ||
| + | |13:45 | ||
| + | |65 ft | ||
| + | |7 °C | ||
| + | |5 °C | ||
| + | |SW | ||
| + | |~1 | ||
| + | |51.50598° | ||
| + | |000.16958° | ||
| + | |- | ||
| + | !scope="col" style="background:#efefef;" | E | ||
| + | | | ||
| + | |52 ft | ||
| + | |5 °C | ||
| + | |6 °C | ||
| + | | | ||
| + | | | ||
| + | |51.50597° | ||
| + | |000.16958° | ||
| + | |- | ||
| + | !scope="col" style="background:#efefef;" | E | ||
| + | | | ||
| + | |55 ft | ||
| + | |6 °C | ||
| + | |5 °C | ||
| + | | | ||
| + | | | ||
| + | |51.50597° | ||
| + | |000.16956° | ||
| + | |- | ||
| + | !scope="col" style="background:#efefef;" | E average | ||
| + | !scope="col" style="background:#80000; color:#FFFFFF;" | 13:45 | ||
| + | !scope="col" style="background:#80000; color:#FFFFFF;" | 57.3 ft | ||
| + | !scope="col" style="background:#80000; color:#FFFFFF;" | 6.0 °C | ||
| + | !scope="col" style="background:#80000; color:#FFFFFF;" | 5.3 °C | ||
| + | !scope="col" style="background:#80000; color:#FFFFFF;" | SW | ||
| + | !scope="col" style="background:#80000; color:#FFFFFF;" | ~1 | ||
| + | !scope="col" style="background:#80000; color:#FFFFFF;" | 51.50597° | ||
| + | !scope="col" style="background:#80000; color:#FFFFFF;" | 000.16957° | ||
| + | |- | ||
| + | !scope="col" style="background: black" | | ||
| + | !scope="col" style="background: black" | | ||
| + | !scope="col" style="background: black" | | ||
| + | !scope="col" style="background: black" | | ||
| + | !scope="col" style="background: black" | | ||
| + | !scope="col" style="background: black" | | ||
| + | !scope="col" style="background: black" | | ||
| + | !scope="col" style="background: black" | | ||
| + | !scope="col" style="background: black" | | ||
| + | |- | ||
| + | !scope="col" style="background:#efefef;" | G | ||
| + | |13:55 | ||
| + | |72 ft | ||
| + | |5 °C | ||
| + | |6 °C | ||
| + | |SW | ||
| + | |~1 | ||
| + | |51.50727° | ||
| + | |000.17469° | ||
| + | |- | ||
| + | !scope="col" style="background:#efefef;" | G | ||
| + | | | ||
| + | |70 ft | ||
| + | |5 °C | ||
| + | |5 °C | ||
| + | | | ||
| + | | | ||
| + | |51.50732° | ||
| + | |000.17467° | ||
| + | |- | ||
| + | !scope="col" style="background:#efefef;" | G | ||
| + | | | ||
| + | |70 ft | ||
| + | |6 °C | ||
| + | |6 °C | ||
| + | | | ||
| + | | | ||
| + | |51.50729° | ||
| + | |000.17469° | ||
| + | |- | ||
| + | !scope="col" style="background:#efefef;" | G average | ||
| + | !scope="col" style="background:#80000; color:#FFFFFF;" | 13:55 | ||
| + | !scope="col" style="background:#80000; color:#FFFFFF;" | 70.6 ft | ||
| + | !scope="col" style="background:#80000; color:#FFFFFF;" | 5.3 °C | ||
| + | !scope="col" style="background:#80000; color:#FFFFFF;" | 5.6 °C | ||
| + | !scope="col" style="background:#80000; color:#FFFFFF;" | SW | ||
| + | !scope="col" style="background:#80000; color:#FFFFFF;" | ~1 | ||
| + | !scope="col" style="background:#80000; color:#FFFFFF;" | 51.50729° | ||
| + | !scope="col" style="background:#80000; color:#FFFFFF;" | 000.17468° | ||
| + | |- | ||
| + | !scope="col" style="background: black" | | ||
| + | !scope="col" style="background: black" | | ||
| + | !scope="col" style="background: black" | | ||
| + | !scope="col" style="background: black" | | ||
| + | !scope="col" style="background: black" | | ||
| + | !scope="col" style="background: black" | | ||
| + | !scope="col" style="background: black" | | ||
| + | !scope="col" style="background: black" | | ||
| + | !scope="col" style="background: black" | | ||
| + | |- | ||
| + | !scope="col" style="background:#efefef;" | K | ||
| + | |14:16 | ||
| + | |83 ft | ||
| + | |5 °C | ||
| + | |5 °C | ||
| + | |SW | ||
| + | |~1 | ||
| + | |51.51070° | ||
| + | |000.17588° | ||
| + | |- | ||
| + | !scope="col" style="background:#efefef;" | K | ||
| + | | | ||
| + | |79 ft | ||
| + | |5 °C | ||
| + | |5 °C | ||
| + | | | ||
| + | | | ||
| + | |51.51070° | ||
| + | |000.17589° | ||
| + | |- | ||
| + | !scope="col" style="background:#efefef;" | K | ||
| + | | | ||
| + | |79 ft | ||
| + | |5 °C | ||
| + | |5 °C | ||
| + | | | ||
| + | | | ||
| + | |51.51067° | ||
| + | |000.17586° | ||
| + | |- | ||
| + | !scope="col" style="background:#efefef;" | K average | ||
| + | !scope="col" style="background:#80000; color:#FFFFFF;" | 14:16 | ||
| + | !scope="col" style="background:#80000; color:#FFFFFF;" | 80.3 ft | ||
| + | !scope="col" style="background:#80000; color:#FFFFFF;" | 5.0 °C | ||
| + | !scope="col" style="background:#80000; color:#FFFFFF;" | 5.0 °C | ||
| + | !scope="col" style="background:#80000; color:#FFFFFF;" | SW | ||
| + | !scope="col" style="background:#80000; color:#FFFFFF;" | ~1 | ||
| + | !scope="col" style="background:#80000; color:#FFFFFF;" | 51.51069° | ||
| + | !scope="col" style="background:#80000; color:#FFFFFF;" | 000.17588° | ||
| + | |- | ||
| + | !scope="col" style="background: black" | | ||
| + | !scope="col" style="background: black" | | ||
| + | !scope="col" style="background: black" | | ||
| + | !scope="col" style="background: black" | | ||
| + | !scope="col" style="background: black" | | ||
| + | !scope="col" style="background: black" | | ||
| + | !scope="col" style="background: black" | | ||
| + | !scope="col" style="background: black" | | ||
| + | !scope="col" style="background: black" | | ||
| + | |- | ||
| + | !scope="col" style="background:#efefef;" | C | ||
| + | |14:35 | ||
| + | |95 ft | ||
| + | |5 °C | ||
| + | |5 °C | ||
| + | |SW | ||
| + | |~1 | ||
| + | |51.50637° | ||
| + | |000.18191° | ||
| + | |- | ||
| + | !scope="col" style="background:#efefef;" | C | ||
| + | | | ||
| + | |87 ft | ||
| + | |5 °C | ||
| + | |5 °C | ||
| + | | | ||
| + | | | ||
| + | |51.50636° | ||
| + | |000.18189° | ||
| + | |- | ||
| + | !scope="col" style="background:#efefef;" | C | ||
| + | | | ||
| + | |90 ft | ||
| + | |6 °C | ||
| + | |5 °C | ||
| + | | | ||
| + | | | ||
| + | |51.50636° | ||
| + | |000.18188° | ||
| + | |- | ||
| + | !scope="col" style="background:#efefef;" | C average | ||
| + | !scope="col" style="background:#80000; color:#FFFFFF;" | 14:35 | ||
| + | !scope="col" style="background:#80000; color:#FFFFFF;" | 90.6 ft | ||
| + | !scope="col" style="background:#80000; color:#FFFFFF;" | 5.3 °C | ||
| + | !scope="col" style="background:#80000; color:#FFFFFF;" | 5.0 °C | ||
| + | !scope="col" style="background:#80000; color:#FFFFFF;" | SW | ||
| + | !scope="col" style="background:#80000; color:#FFFFFF;" | ~1 | ||
| + | !scope="col" style="background:#80000; color:#FFFFFF;" | 61.50636° | ||
| + | !scope="col" style="background:#80000; color:#FFFFFF;" | 000.18189° | ||
| + | |- | ||
| + | !scope="col" style="background: black" | | ||
| + | !scope="col" style="background: black" | | ||
| + | !scope="col" style="background: black" | | ||
| + | !scope="col" style="background: black" | | ||
| + | !scope="col" style="background: black" | | ||
| + | !scope="col" style="background: black" | | ||
| + | !scope="col" style="background: black" | | ||
| + | !scope="col" style="background: black" | | ||
| + | !scope="col" style="background: black" | | ||
| + | |- | ||
| + | !scope="col" style="background:#efefef;" | B | ||
| + | |17:00 | ||
| + | |98 ft | ||
| + | |7 °C | ||
| + | |5 °C | ||
| + | |SW | ||
| + | |~1 | ||
| + | |51.52550° | ||
| + | |000.14784° | ||
| + | |- | ||
| + | !scope="col" style="background:#efefef;" | B | ||
| + | | | ||
| + | |99 ft | ||
| + | |7 °C | ||
| + | |5 °C | ||
| + | | | ||
| + | | | ||
| + | |51.52537° | ||
| + | |000.14751° | ||
| + | |- | ||
| + | !scope="col" style="background:#efefef;" | B | ||
| + | | | ||
| + | |98 ft | ||
| + | |7 °C | ||
| + | |5 °C | ||
| + | | | ||
| + | | | ||
| + | |51.52538° | ||
| + | |000.14751° | ||
| + | |- | ||
| + | !scope="col" style="background:#efefef;" | B average | ||
| + | !scope="col" style="background:#80000; color:#FFFFFF;" | 17:00 | ||
| + | !scope="col" style="background:#80000; color:#FFFFFF;" | 98.3 ft | ||
| + | !scope="col" style="background:#80000; color:#FFFFFF;" | 7.0 °C | ||
| + | !scope="col" style="background:#80000; color:#FFFFFF;" | 5.0 °C | ||
| + | !scope="col" style="background:#80000; color:#FFFFFF;" | SW | ||
| + | !scope="col" style="background:#80000; color:#FFFFFF;" | ~1 | ||
| + | !scope="col" style="background:#80000; color:#FFFFFF;" | 51.52542° | ||
| + | !scope="col" style="background:#80000; color:#FFFFFF;" | 000.14762° | ||
| + | |- | ||
| + | !scope="col" style="background: black" | | ||
| + | !scope="col" style="background: black" | | ||
| + | !scope="col" style="background: black" | | ||
| + | !scope="col" style="background: black" | | ||
| + | !scope="col" style="background: black" | | ||
| + | !scope="col" style="background: black" | | ||
| + | !scope="col" style="background: black" | | ||
| + | !scope="col" style="background: black" | | ||
| + | !scope="col" style="background: black" | | ||
| + | |- | ||
| + | !scope="col" style="background:#efefef;" | F | ||
| + | |17:25 | ||
| + | |91 ft | ||
| + | |6 °C | ||
| + | |5 °C | ||
| + | |SW | ||
| + | |~1 | ||
| + | |51.52781° | ||
| + | |000.16091° | ||
| + | |- | ||
| + | !scope="col" style="background:#efefef;" | F | ||
| + | | | ||
| + | |110 ft | ||
| + | |6 °C | ||
| + | |5 °C | ||
| + | | | ||
| + | | | ||
| + | |51.52780° | ||
| + | |000.16091° | ||
| + | |- | ||
| + | !scope="col" style="background:#efefef;" | F | ||
| + | | | ||
| + | |98 ft | ||
| + | |6 °C | ||
| + | |5 °C | ||
| + | | | ||
| + | | | ||
| + | |51.52779° | ||
| + | |000.16092° | ||
| + | |- | ||
| + | !scope="col" style="background:#efefef;" | F average | ||
| + | !scope="col" style="background:#80000; color:#FFFFFF;" | 17:25 | ||
| + | !scope="col" style="background:#80000; color:#FFFFFF;" | 99.6 ft | ||
| + | !scope="col" style="background:#80000; color:#FFFFFF;" | 6.0 °C | ||
| + | !scope="col" style="background:#80000; color:#FFFFFF;" | 5.0 °C | ||
| + | !scope="col" style="background:#80000; color:#FFFFFF;" | SW | ||
| + | !scope="col" style="background:#80000; color:#FFFFFF;" | ~1 | ||
| + | !scope="col" style="background:#80000; color:#FFFFFF;" | 51.52780° | ||
| + | !scope="col" style="background:#80000; color:#FFFFFF;" | 000.16091° | ||
| + | |- | ||
| + | !scope="col" style="background: black" | | ||
| + | !scope="col" style="background: black" | | ||
| + | !scope="col" style="background: black" | | ||
| + | !scope="col" style="background: black" | | ||
| + | !scope="col" style="background: black" | | ||
| + | !scope="col" style="background: black" | | ||
| + | !scope="col" style="background: black" | | ||
| + | !scope="col" style="background: black" | | ||
| + | !scope="col" style="background: black" | | ||
| + | |} | ||
| + | |||
| + | |||
| + | |||
| + | |||
| + | |||
| + | |||
| + | |||
| + | |||
| + | |||
| + | |||
| + | |||
| + | |||
| + | |||
| + | |||
| + | |||
| + | |||
| + | |||
| + | |||
| + | |||
| + | |||
| + | |||
| + | |||
| + | |||
| + | |||
| + | |||
| + | |||
| + | |||
| + | |||
| + | |||
| + | |||
| + | |||
| + | |||
| + | |||
| + | |||
| + | |||
| + | |||
| + | |||
| + | |||
| + | |||
| + | |||
| + | |||
| + | |||
| + | |||
| + | |||
| + | |||
| + | |||
| + | |||
| + | |||
| + | |||
| + | |||
| + | |||
| + | |||
| + | |||
| + | |||
| + | |||
| + | |||
| + | |||
| + | |||
| + | |||
| + | |||
| + | |||
| + | |||
| + | |||
| + | |||
| + | |||
| + | |||
| + | |||
| + | |||
| + | |||
| + | |||
| + | |||
| + | |||
| + | |||
| + | |||
| + | |||
| + | |||
| + | |||
| + | |||
| + | |||
| + | |||
| + | |||
| + | |||
| + | |||
| + | |||
| + | |||
| + | |||
| + | |||
| + | |||
| + | |||
| + | |||
| + | |||
| + | |||
| + | |||
| + | |||
| + | |||
| + | |||
| + | |||
| + | |||
| + | |||
| + | |||
| + | |||
| + | |||
| + | |||
| + | |||
| + | |||
| + | |||
| + | |||
| + | |||
| + | |||
| + | |||
| + | |||
| + | |||
| + | |||
| + | |||
| + | |||
| + | |||
| + | |||
| + | |||
| + | |||
| + | |||
| + | |||
| + | |||
| + | |||
| + | |||
| + | |||
| + | |||
| + | |||
| + | |||
| + | |||
| + | |||
| + | ==== <span style="color:#FF0000"> ''' Appendix B: Visualization ''' </span> ==== | ||
| + | |||
| + | |||
| + | Visualization No1. | ||
| + | (Some text here, explaining...) | ||
| + | [[Image:Temp-elevation.JPG]] | ||
| + | |||
| + | |||
| + | Visualization No2. | ||
| + | (Some text here, explaining...) | ||
| + | [[Image:No2.jpg]] | ||
| + | |||
| + | |||
| + | |||
| + | |||
| + | |||
| + | |||
| + | ==== <span style="color:#FF0000"> ''' Appendix C: Who Did What''' </span> ==== | ||
| + | |||
| + | |||
| + | |||
| + | |||
| + | '''Eva Marengo''' | ||
| + | My contribution to the lab was taking the water and air temperature readings and helping record the data. At each location I took three readings of the water and of the air. In the lab report I did the associated write up. I also assisted at navigation and finding the perspective of the photos taken in order to replicate them. | ||
| + | |||
| + | |||
| + | |||
| + | '''Vivian Bateyunga''' | ||
| + | My contribution to the lab was collecting data on wind direction using a basic compass and a Tesco plastic bag. I also described what was North and South of the location of the water body. I assisted with copy-editing the lab write up and figuring out the averages for the raw data collected. | ||
| + | |||
| + | |||
| + | |||
| + | '''Sandra Mamus Ngeseyan''' | ||
| + | I was the principle data-recorder for the group and also helped determine what the wind-speed at each location was. It was extremely important that my handwriting was neat and the recording of data was done in an organized fashion. I helped to write up the description of the lab, as well as gather information from different members of the group. | ||
| + | |||
| + | |||
| + | |||
| + | '''Ivan Babic''' | ||
| + | I helped with geocoding and determining where are the places exactly and how to get there. I was collecting data of Latitude, Longitude and Elevation. Wiki editing and visualization of data. | ||
| + | |||
| + | |||
| + | === England-2011-lab2-green === | ||
| + | <span style="color:green">Green</span>: Krystnell, Johanna, Spencer, McKayla, Gillian | ||
| + | |||
| + | ==== Problem Description and Approach ==== | ||
| + | |||
| + | For this lab, Dr. Obsfucation sent out eleven photographs of various bodies of water around central London. He informed us that Penelope Poison was threatening to release toxic substances at each location; he asked the Green Team to find each location using the photographs and take several readings at each location: longitude, latitude, elevation, wind direction, wind speed, water temperature, and air temperature. More importantly, for every reading it was necessary that we take three readings in order to make an accurate measurement. | ||
| + | |||
| + | Our initial approach dealt with using the geo-coding of each photograph to identify the longitude and latitude and then map out the locations. The photos were downloaded and imported into iPhoto, where the "Places" application created a map of the locations. With a time element involved, we decided to head towards Regents Park first, where two photographs were taken, and make our way back to Trafalgar Square, via Hyde Park and then Green Park / St. James Park. The methodology for the collection of necessary data is explained below. | ||
| + | |||
| + | ==== Data Collection ==== | ||
| + | In order to measure the latitude, longitude, and elevation of each site, we took three separate readings using a yellow Etrex GPS unit. At each location, we turned on the unit, waited for it to locate the satellites, and recorded the first set of readings. Then we moved the GPS unit away from the location and back to cause the GPS to take a new reading from the satellites. We recorded this second set of raw data and then moved the GPS a second time to for a final set of readings. | ||
| + | |||
| + | In order to determine wind direction, three group members took turns using a cigarette lighter at the location to determine the direction of the breeze, faced in that direction, and then took an angle reading using the compass. All three readings were recorded. In order to determine wind speed, different group members used the Beaufort scale to estimate a speed without consulting each other, and recorded their decision. | ||
| + | |||
| + | To determine water temperature, we pointed the Mini Infared Thermometer Fluke-62 at the body of water pictured in each photograph, recorded the temperature reading, and repeated this process two more times to come up with three readings. To determine the temperature of the air, we pointed the infared thermometer at the sky, pressed the button to take a reading, and repeated this two more times to produce three readings. | ||
| + | |||
| + | ==== Data Analysis ==== | ||
| + | |||
| + | {| border="3" style="margin-left: 3em;" | ||
| + | |- | ||
| + | ! scope="col" | | ||
| + | ! scope="col" | Location A | ||
| + | ! scope="col" | Location B | ||
| + | ! scope="col" | Location C | ||
| + | ! scope="col" | Location D | ||
| + | ! scope="col" | Location E | ||
| + | ! scope="col" | Location F | ||
| + | ! scope="col" | Location G | ||
| + | ! scope="col" | Location H | ||
| + | ! scope="col" | Location I | ||
| + | ! scope="col" | Location J | ||
| + | ! scope="col" | Location K | ||
| + | |- | ||
| + | ! scope="row" | Longitude | ||
| + | | 51° 30.177' | ||
| + | | 51° 31.522' | ||
| + | | 51° 30.382' | ||
| + | | 51° 30.209' | ||
| + | | 51° 30.355' | ||
| + | | 51° 31.699' | ||
| + | | 51° 30.446' | ||
| + | | 51° 30.492' | ||
| + | | 51° 30.265' | ||
| + | | 51° 30.107' | ||
| + | | 51° 30.641' | ||
| + | |- | ||
| + | ! scope="row" | Latitude | ||
| + | | 0° 8.554' | ||
| + | | 0° 8.852' | ||
| + | | 0° 10.915' | ||
| + | | 0° 7.917' | ||
| + | | 0° 10.094' | ||
| + | | 0° 9.652' | ||
| + | | 0° 10.492' | ||
| + | | 0° 7.651' | ||
| + | | 0° 9.604' | ||
| + | | 0° 8.326' | ||
| + | | 0° 10.552' | ||
| + | |- | ||
| + | ! scope="row" | Elevation | ||
| + | | 3 m | ||
| + | | 35 m | ||
| + | | 22.6 m | ||
| + | | (-)3.6 m | ||
| + | | 14 m | ||
| + | | 30 m | ||
| + | | 13.6 m | ||
| + | | 5.6 m | ||
| + | | 14.6 m | ||
| + | | 3 m | ||
| + | | 16.3 m | ||
| + | |- | ||
| + | ! scope="row" | Wind Direction | ||
| + | | 258.3° | ||
| + | | 203.3° | ||
| + | | 243.3° | ||
| + | | 323.3° | ||
| + | | 165° | ||
| + | | 238.3° | ||
| + | | 250° | ||
| + | | 48.3° | ||
| + | | 286.6° | ||
| + | | 32.6° | ||
| + | | 223.3° | ||
| + | |- | ||
| + | ! scope="row" | Wind Speed | ||
| + | | 2 mph | ||
| + | | 3.6 mph | ||
| + | | 3 mph | ||
| + | | 5.3 mph | ||
| + | | 4 mph | ||
| + | | 4.6 mph | ||
| + | | 2 mph | ||
| + | | 2.6 mph | ||
| + | | 2.3 mph | ||
| + | | 1.6 mph | ||
| + | | 2 mph | ||
| + | |- | ||
| + | ! scope="row" | Water Temperature | ||
| + | | 43.16°F | ||
| + | | 39.16°F | ||
| + | | 39.16°F | ||
| + | | 39.83°F | ||
| + | | 39°F | ||
| + | | 38.3°F | ||
| + | | 39.83°F | ||
| + | | 38.3°F | ||
| + | | 39.6°F | ||
| + | | 39.83°F | ||
| + | | 38.83°F | ||
| + | |- | ||
| + | ! scope="row" | Air Temperature | ||
| + | | 32.3°F | ||
| + | | 35.16°F | ||
| + | | 33.16°F | ||
| + | | 32.16°F | ||
| + | | 32.6°F | ||
| + | | 32.16°F | ||
| + | | 34.5°F | ||
| + | | 32.83°F | ||
| + | | 33.6°F | ||
| + | | 31.83°F | ||
| + | | 34.6°F | ||
| + | |||
| + | |} | ||
| + | |||
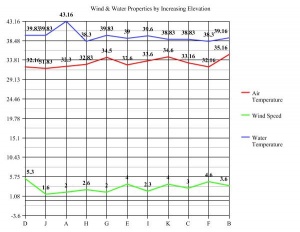
| + | The air temperatures between our locations did not vary much they were all low temperatures with a range of 31°F-34°F. Due to this Penelope Poison cannot be harmful to the city of London because toxins are usually produced at warm temperatures. Also the water temperatures were mostly low in our locations except Green Park where the temperature was slightly higher than other places. This place has a higher risk of having toxins from Penelope Poison as compared to other locations we have been to. The wind speed in most of the areas that we went to was minimal therefore those areas have a low risk of getting toxins from Penelope Poison. St James Park had a higher wind speed as compared to the other areas we went to therefore the risk of having toxins from Penelope Poison are slightly higher in this place than other areas. | ||
| + | |||
| + | ==== Error Analysis ==== | ||
| + | |||
| + | '''GPS -''' The Etrex yellow GPS used to calculate the latitude and longitude of each location may be responsible for several significant sources of error during data collection. We noted that in locations such as Trafalgar square, where there were a number of tall buildings, signal reflection may have caused the information being sent to the receiver to be delayed contributing to further inaccuracy. Although the data obtained in very open locations such as parks were unlikely to be affected by a signal reflection, it is possible that interference with accurate data is attributable to a clock error within the GPS. If the clock inside the GPS was in fact not the same as the clocks of the satellites, this may have resulted in incorrect calculations. However, it was indicated by the system that all values obtained were within the range of +/- 3 metres. At 51 degrees latitude and thirty minutes, the length of one degree latitude is 111,258 metres. This means that the possible error is minimal ( +/- 0.000027 degrees). The length of a degree longitude is 69,440 and again the air is minimal ( +/- 0.000043 degrees). | ||
| + | |||
| + | '''Wind direction/Compass -''' We calculated the degree of human error in using the compass as well as a cigarette lighter to be +/- 5 degrees. It is possible that because three different persons were chosen to read the compass, the angle at which it was being held may not have been completely flat, and estimations may have been incorrect based on different strengths in vision. Also, in using a lighter to determine the general direction of the wind we noticed that at several times the direction of the wind changed. We attributed this to that fact that trees other obstructions may have caused the wind to shift its direction and noted it as a significant source of error. | ||
| + | |||
| + | '''Beaufort Scale -''' Our reliance on the Beaufort Scale to determine wind speed made our data collection especially sensitive to error. Although there was an intentional lack of discussion among the three group members chosen to use the scale at the different locations, there was a certain homogeneity of results as these members revealed their choices. Furthermore, no matter how basic the descriptions of the scale were, the data became relative to each individuals interpretation of these groupings | ||
| + | |||
| + | '''Mini Infrared thermometer (fluke-62) -''' A mini infrared thermometer (fluke-62) was used to calculate the air and water temperature at the various locations. Sources of error were expected to be minimal because of a consistency in measuring the temperature of same spot at each of these locations. It was discovered after data collection that our decision to point the thermometer to the sky to obtain a temperature may have contributed to incorrect readings. It would have been possible to reduce errors associated with this by aiming the thermometer a leaf at the different sites. Despite taking multiple readings and obtaining very similar numbers we note that the margin of error for the thermometer is +/- 4 degrees Celsius. | ||
| + | |||
| + | ==== Images ==== | ||
| + | |||
| + | '''Location A''' | ||
| + | |||
| + | [[Image:loc-a.jpg|center|thumb|Dr. Obfuscation's photograph of Location A]] | ||
| + | |||
| + | |||
| + | [[Image:green-a.jpg|center|thumb|Green Team's photograph of Location A]] | ||
| + | |||
| + | '''Location B''' | ||
| + | |||
| + | [[Image:loc-b.jpg|center|thumb|Dr. Obfuscation's photograph of Location B]] | ||
| + | |||
| + | |||
| + | [[Image:green-b.jpg|center|thumb|Green Team's photograph of Location B]] | ||
| + | |||
| + | '''Location C''' | ||
| + | |||
| + | [[Image:loc-c.jpg|center|thumb|Dr. Obfuscation's photograph of Location C]] | ||
| + | |||
| + | |||
| + | [[Image:green-c.jpg|center|thumb|Green Team's photograph of Location C]] | ||
| + | |||
| + | '''Location D''' | ||
| + | |||
| + | [[Image:loc-d.jpg|center|thumb|Dr. Obfuscation's photograph of Location D]] | ||
| + | |||
| + | |||
| + | [[Image:green-d.jpg|center|thumb|Green Team's photograph of Location D]] | ||
| + | |||
| + | '''Location E''' | ||
| + | |||
| + | [[Image:loc-e.jpg|center|thumb|Dr. Obfuscation's photograph of Location E]] | ||
| + | |||
| + | |||
| + | [[Image:green-e.jpg|center|thumb|Green Team's photograph of Location E]] | ||
| + | |||
| + | '''Location F''' | ||
| + | |||
| + | [[Image:loc-f.jpg|center|thumb|Dr. Obfuscation's photograph of Location F]] | ||
| + | |||
| + | |||
| + | [[Image:green-f.jpg|center|thumb|Green Team's photograph of Location F]] | ||
| + | |||
| + | '''Location G''' | ||
| + | |||
| + | [[Image:loc-g.jpg|center|thumb|Dr. Obfuscation's photograph of Location G]] | ||
| + | |||
| + | |||
| + | [[Image:green-g.jpg|center|thumb|Green Team's photograph of Location G]] | ||
| + | |||
| + | '''Location H''' | ||
| + | |||
| + | [[Image:loc-h.jpg|center|thumb|Dr. Obfuscation's photograph of Location H]] | ||
| + | |||
| + | |||
| + | [[Image:green-h.jpg|center|thumb|Green Team's photograph of Location H]] | ||
| + | |||
| + | '''Location I''' | ||
| + | |||
| + | [[Image:loc-i.jpg|center|thumb|Dr. Obfuscation's photograph of Location I]] | ||
| + | |||
| + | |||
| + | [[Image:green-i.jpg|center|thumb|Green Team's photograph of Location I]] | ||
| + | |||
| + | '''Location J''' | ||
| + | |||
| + | [[Image:loc-j.jpg|center|thumb|Dr. Obfuscation's photograph of Location J]] | ||
| + | |||
| + | |||
| + | [[Image:green-j.jpg|center|thumb|Green Team's photograph of Location J]] | ||
| + | |||
| + | '''Location K''' | ||
| + | |||
| + | [[Image:loc-k.jpg|center|thumb|Dr. Obfuscation's photograph of Location K]] | ||
| + | |||
| + | |||
| + | [[Image:green-k.jpg|center|thumb|Green Team's photograph of Location K]] | ||
| + | |||
| + | ==== Appendix A: Raw Data ==== | ||
| + | |||
| + | Note: The last reading is the average of all three readings. | ||
| + | |||
| + | '''Location A''' | ||
| + | |||
| + | Lat – 51° 30.178’ ; 51° 30.177’ ; 51° 30.177’ ---- 51° 30.177' | ||
| + | |||
| + | Long – 0° 8.553’ ; 0° 8.556’ ; 0° 8.554’ ---- 0° 8.554' | ||
| + | |||
| + | Elv – 2 m ; 3 m ; 4 m ---- 3 m | ||
| + | |||
| + | Wind Direction – 260° ; 255° ; 260° ---- 258.3° | ||
| + | |||
| + | Wind speed – 1 (1 mph) ; 1 (2 mph) ; 1 (3 mph)---- 2 mph | ||
| + | |||
| + | Water Temp – 43°F ; 43°F ; 43.5°F ---- 43.16°F | ||
| + | |||
| + | Air Temp – 32°F ; 32.5°F ; 32.5°F ---- 32.3°F | ||
| + | |||
| + | '''Location B''' | ||
| + | |||
| + | Lat – 51° 31.521’ ; 51° 31.522’ ; 51° 31.523’ ---- 51° 31.522' | ||
| + | |||
| + | Long – 0° 8.852’ ; 0° 8.851’ ; 0° 8.852’ ---- 0° 8.852' | ||
| + | |||
| + | Elv – 36 m ; 34m ; 35 m ---- 35 m | ||
| + | |||
| + | Wind Direction – 210° ; 200° ; 200° ---- 203.3° | ||
| + | |||
| + | Wind speed – 2 (5 mph) ; 2 (4 mph) ; 1 (2 mph)---- 3.6 mph | ||
| + | |||
| + | Water Temp – 40°F ; 39°F ; 38.5°F ---- 39.16°F | ||
| + | |||
| + | Air Temp – 38°F ; 35°F ; 32.5°F ---- 35.16°F | ||
| + | |||
| + | '''Location C''' | ||
| + | |||
| + | Lat – 51° 30.383’ ; 51° 30.382’ ; 51° 30.382’ ---- 51° 30.382' | ||
| + | |||
| + | Long – 0° 10.914’ ; 0° 10.915’ ; 0° 10.915’ ---- 0° 10.915' | ||
| + | |||
| + | Elv – 22 m ; 22 m ; 24 m ---- 22.6 m | ||
| + | |||
| + | Wind Direction – 240° ; 245° ; 245° ---- 243.3° | ||
| + | |||
| + | Wind speed – 1 (2mph) ; 1 (3 mph) ; 2 (4 mph) ---- 3 mph | ||
| + | |||
| + | Water Temp – 39°F ; 39°F ; 38.5°F ---- 39.16°F | ||
| + | |||
| + | Air Temp – 33°F ; 33°F ; 33.5°F ---- 33.16°F | ||
| + | |||
| + | '''Location D''' | ||
| + | |||
| + | Lat – 51° 30.208’ ; 51° 30.208’ ; 51° 30.210’ ---- 51° 30.209' | ||
| + | |||
| + | Long – 0° 7.915’ ; 0° 7.918’ ; 0° 7.917’ ---- 0° 7.917' | ||
| + | |||
| + | Elv – (-)6 m ; (-)3 m ; (-)2 m ---- (-)3.6 m | ||
| + | |||
| + | Wind Direction – 320° ; 330° ; 320° ---- 323.3° | ||
| + | |||
| + | Wind speed – 2 (6 mph) ; 2 (5 mph) ; 2 (5 mph) ---- 5.3 mph | ||
| + | |||
| + | Water Temp – 40°F ; 40°F ; 39.5°F ---- 39.83°F | ||
| + | |||
| + | Air Temp – 32.5°F ; 32°F ; 32°F ---- 32.16°F | ||
| + | |||
| + | '''Location E''' | ||
| + | |||
| + | Lat – 51° 30.354’ ; 51° 30.356’ ; 51° 30.354’ ---- 51° 30.355' | ||
| + | |||
| + | Long – 0° 10.091’ ; 0° 10.091’ ; 0° 10.101’ ---- 0° 10.094' | ||
| + | |||
| + | Elv – 13 m ; 16 m ; 13 m ---- 14 m | ||
| + | |||
| + | Wind Direction – 160° ; 170° ; 165° ---- 165° | ||
| + | |||
| + | Wind speed – 2 (4 mph) ; 1 (3 mph) ; 2 (5 mph) ---- 4 mph | ||
| + | |||
| + | Water Temp – 40°F ; 38.5°F ; 38.5°F ---- 39°F | ||
| + | |||
| + | Air Temp – 32.5°F ; 32.5°F ; 33°F ---- 32.6°F | ||
| + | |||
| + | '''Location F''' | ||
| + | |||
| + | Lat – 51° 31.669’ ; 51° 31.669’ ; 51° 31.668’ ---- 51° 31.699' | ||
| + | |||
| + | Long – 0° 9.652’ ; 0° 9.652’ ; 0° 9.651’ ---- 0° 9.652' | ||
| + | |||
| + | Elv – 31 m ; 31 m ; 28 m ---- 30 m | ||
| + | |||
| + | Wind Direction – 240° ; 245° ; 230° ---- 238.3° | ||
| + | |||
| + | Wind speed – 2 (5 mph) ; 2 (4 mph) ; 2 (5 mph) ---- 4.6 mph | ||
| + | |||
| + | Water Temp – 38.5°F ; 38.5°F ; 38°F ---- 38.3°F | ||
| + | |||
| + | Air Temp – 32°F ; 32°F ; 32.5°F ---- 32.16°F | ||
| + | |||
| + | '''Location G''' | ||
| + | |||
| + | Lat – 51° 30.446’ ; 51° 30.445’ ; 51° 30.446’ ---- 51° 30.446' | ||
| + | |||
| + | Long – 0° 10.492’ ; 0° 10.492’ ; 0° 10.491’ ---- 0° 10.492' | ||
| + | |||
| + | Elv – 13 m ; 14 m ; 14 m ---- 13.6 m | ||
| + | |||
| + | Wind Direction – 260° ; 240° ; 250° ---- 250° | ||
| + | |||
| + | Wind speed – 1 (2 mph) ; 1 (2 mph) ; 1 (2 mph) ---- 2 mph | ||
| + | |||
| + | Water Temp – 39.5°F ; 40°F ; 40°F ---- 39.83°F | ||
| + | |||
| + | Air Temp – 34.5°F ; 34.5°F ; 34.5°F ---- 34.5°F | ||
| + | |||
| + | '''Location H''' | ||
| + | |||
| + | Lat – 51° 30.492’ ; 51° 30.492’ ; 51° 30.491’ ---- 51° 30.492' | ||
| + | |||
| + | Long – 0° 7.650’ ; 0° 7.651’ ; 0° 7.651’ ---- 0° 7.651' | ||
| + | |||
| + | Elv – 6 m ; 5 m ; 6 m ---- 5.6 m | ||
| + | |||
| + | Wind Direction – 40° ; 50° ; 55° ---- 48.3° | ||
| + | |||
| + | Wind speed – 1 (3mph) ; 1 (3 mph) ; 1 (2mph) ---- 2.6 mph | ||
| + | |||
| + | Water Temp – 38.5°F ; 38°F ; 38.5°F ---- 38.3°F | ||
| + | |||
| + | Air Temp – 33°F ; 32.5°F ; 33°F ---- 32.83°F | ||
| + | |||
| + | '''Location I''' | ||
| + | |||
| + | Lat – 51° 30.265’ ; 51° 30.264’ ; 51° 30.265’ ---- 51° 30.265' | ||
| + | |||
| + | Long – 0° 9.604’ ; 0° 9.604’ ; 0° 9.604’ ---- 0° 9.604' | ||
| + | |||
| + | Elv – 13 m ; 16 m ; 15 m ---- 14.6 m | ||
| + | |||
| + | Wind Direction – 300° ; 280° ; 280° ---- 286.6° | ||
| + | |||
| + | Wind speed – 1 (3 mph) ; 1 (2 mph) ; 1 (2 mph) ---- 2.3 mph | ||
| + | |||
| + | Water Temp – 39.5°F ; 39.5°F ; 40°F ---- 39.6°F | ||
| + | |||
| + | Air Temp – 33.5°F ; 33.5°F ; 34°F ---- 33.6°F | ||
| + | |||
| + | '''Location J''' | ||
| + | |||
| + | Lat – 51° 30.108’ ; 51° 30.106’ ; 51° 30.106’ ---- 51° 30.107' | ||
| + | |||
| + | Long – 0° 8.326’ ; 0° 8.326’ ; 0° 8.325’ ---- 0° 8.326' | ||
| + | |||
| + | Elv – 2 m ; 3 m ; 4 m ---- 3 m | ||
| + | |||
| + | Wind Direction – 30° ; 33° ; 35° ---- 32.6° | ||
| + | |||
| + | Wind speed – 1 (2 mph) ; 1 (1 mph) ; 1 (2 mph) ---- 1.6 mph | ||
| + | |||
| + | Water Temp – 40°F ; 40°F ; 39.5°F ---- 39.83°F | ||
| + | |||
| + | Air Temp – 31.5°F ; 32°F ; 32°F ---- 31.83°F | ||
| + | |||
| + | '''Location K''' | ||
| + | |||
| + | Lat – 51° 30.643’ ; 51° 30.639’ ; 51° 30.641’ ---- 51° 30.641' | ||
| + | |||
| + | Long – 0° 10.551’ ; 0° 10.551’ ; 0° 10.554’ ---- 0° 10.552' | ||
| + | |||
| + | Elv – 17 m ; 15 m ; 17 m ---- 16.3 m | ||
| + | |||
| + | Wind Direction – 220° ; 220° ; 230° ---- 223.3° | ||
| + | |||
| + | Wind speed – 1 (2 mph) ; 1 (3 mph) ; 1 (1 mph) ---- 2 mph | ||
| + | |||
| + | Water Temp – 39°F ; 38.5°F ; 39°F ---- 38.83°F | ||
| + | |||
| + | Air Temp – 34.5°F ; 35°F ; 34.5°F ---- 34.6°F | ||
| + | |||
| + | ==== Appendix B: Visualization ==== | ||
| + | |||
| + | |||
| + | [[Image:graph1.jpg|center|thumb]] | ||
| + | |||
| + | |||
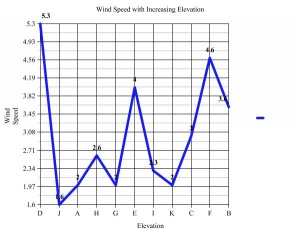
| + | [[Image:graph2.jpg|center|thumb]] | ||
| + | |||
| + | |||
| + | VISUALIZATION WORK | ||
| + | |||
| + | RANGES: | ||
| + | |||
| + | Elevation (-) 3.6m (to) 35m | ||
| + | |||
| + | Wind Direction 32.6 (to) 323.3 | ||
| + | |||
| + | Wind Speed 1.6 (to) 5.3 | ||
| + | |||
| + | Water Temperature 38.3 (to) 43.16 | ||
| + | |||
| + | Air Temperature 31.83 (to) 35.16 | ||
| + | |||
| + | Locations from Low Elevation to High Elevation | ||
| + | |||
| + | 1) D - (-) 3.6m | ||
| + | |||
| + | 2) J - 3m | ||
| + | |||
| + | 3) A - 3m | ||
| + | |||
| + | 4) H - 5.6m | ||
| + | |||
| + | 5) G - 13.6m | ||
| + | |||
| + | 6) E - 14m | ||
| + | |||
| + | 7) I - 14.6m | ||
| + | |||
| + | 8) K - 16.3 m | ||
| + | |||
| + | 9) C - 22.6m | ||
| + | |||
| + | 10) F - 30m | ||
| + | |||
| + | 11) B - 35m | ||
| + | |||
| + | Wind Direction Values in order of location numbers (in degrees): | ||
| + | |||
| + | 323.3, 32.6, 258.3, 48.3, 250, 165, 286.6, 223.3, 243.3, 238.3, 203.3 | ||
| + | |||
| + | Wind Speed Values in order of location numbers (in miles per hour): | ||
| + | |||
| + | 5.3, 1.6, 2, 2.6, 2, 4, 2.3, 2, 3, 4.6, 3.6 | ||
| + | |||
| + | Water Temperature Values in order of location numbers (in degrees Fahrenheit): | ||
| + | |||
| + | 39.83, 39.83, 43.16, 38.3, 39.83, 39, 39.6, 38.83, 38.83, 38.3, 39.16 | ||
| + | |||
| + | Air Temperature Values in order of location numbers (in degrees Fahrenheit) : | ||
| + | |||
| + | 32.16, 31.83, 32.3, 32.83, 34.5, 32.6, 33.6, 34.6, 33.16, 32.16, 35.16 | ||
| + | |||
| + | ==== Appendix C: Who Did What ==== | ||
| + | '''Spencer''' ~ During the lab I was responsible for recording the data as well as providing one of the three readings for both wind direction and wind speed. Because I downloaded the pictures onto my computer before the lab, and was able to identify the geo-coding with iPhoto, I wrote the "Problem Description and Approach". After McKayla calculated the measurements and entered the raw data onto the wiki, I edited it with the proper notations. I also created the table with all of our measurements and made sure the photographs and visualizations were properly embedded. | ||
| + | |||
| + | '''Johanna''' ~ During the lab I used the GPS unit to take readings for latitude, longitude, and elevation, as well as helping determine wind direction with the lighter. I wrote the data collection section of the lab write-up. | ||
| + | |||
| + | '''McKayla''' ~ During the lab I took readings for air and water temperatures at each locations. I also was responsible for taking the Green Team's photographs at each location. I created the visualizations for the data on the lab write-up. | ||
| + | |||
| + | '''Krystnell''' ~ During the lab I was one of the three members responsible for giving a reading for both wind direction and wind speed. In the lab write-up I took care of the sections concerning the sources of error. | ||
| + | |||
| + | '''Gillian''' ~ During the lab I also took the readings of the wind direction and wind speed along with two other people. I also did the second part of the data analysis section. | ||
Revision as of 13:23, 13 February 2025
2025 Note: Most of the original content from these pages is from 2011. It is being condensed here for record keeping.
Contents
- 1 2011 Earlham College England Program
- 2 Science, Technology and Society - Syllabus
- 3 Assignments
- 3.1 Due Friday 25 February
- 3.2 Due Sunday 20 February
- 3.3 Due Saturday 19 February
- 3.4 Due Friday 18 February
- 3.5 Due Thursday 17 February
- 3.6 Due Tuesday 15 February
- 3.7 Due Monday 14 February
- 3.8 Due Friday 11 February
- 3.9 Due Tuesday 8 February
- 3.10 Due Monday 7 February
- 3.11 Due Saturday 5 February
- 3.12 Due Tuesday 1 February
- 3.13 Due Monday 31 January
- 3.14 Saturday 29 January
- 3.15 Due Friday 28 January
- 3.16 Due Tuesday 25 January
- 3.17 Due Monday 24 January
- 3.18 Due Tuesday 17 January
- 3.19 Due Monday 16 January
- 3.20 Due Tuesday 11 January
- 3.21 Due Monday 10 January
- 4 Lab 1: Where Am I?
- 5 Lab 2: Holy Pigeon P#$@ Batman, it's Penelope Poison!
- 6 Lab Notebooks
- 6.1 Lab 1: Where Am I?
- 6.2 Lab 2: Holy Pigeon P#$! Batman, it's Penelope Poison!
2011 Earlham College England Program
This is the wiki for the program. Program related materials and the bulk of the Earlham course materials (Science, Technology and Society) are located here. Other on-line resources for the program are:
- FIE's Moodle entry for the course (So far we're only using this for attendance.)
- Program blog (Posts by Charlie and eventually Fitz and the students too.)
Who we are: Eva Marengo Sanchez, Sandra Ngeseyan, Ben Smith, Krystnell Storr, Spencer Smith, Emily Van Cise, Johanna Wilcox, Ivan Babic, Gillian Bateyunga, Lily Cutler, Bill Greene, McKayla Heller, Vivian Bateyunga, Andrew Fitz Gibbon (program assistant), Charlie Peck (program leader)
London Resources
- Weekend Tube Closures
- Transport for London Journey Planner
- FIE's London center website
- Time Out's event listing for London
Calendar
- Embedded Google calendar goes here, for now: Google Calendar
Excursions
January
- Cambridge (Saturday 15 January)
- Ice Skating at Somerset House (Saturday 22 January)
- Greenwich (Saturday 29 January)
February
- Science Museum (Tuesday 1 February) - Atmosphere, Timekeeping
- Parliament Tour (Tuesday 8 February)
- Whose Science? at the Dana Centre (Wednesday 09 February, 19:00 - 20:30) - optional, requires RSVP
- Greenland at the National Theatre (Friday 11 February)
- Kew Gardens (Saturday 12 Februaryl)
- Designer Life, Cooler World at the Dana Centre (Wednesday 16 February, 19:00 - 20:30) - optional, requires RSVP
- Lab 2: Holy Pigeon P#$! Batman, it's Penelope Poison! (Sunday 20 February, 11:00 - 19:00, with dinner at the flat)
- IQ2: Free Data at the Dana Centre (Tuesday 22 February, 19:00 - 20:30) - optional, requires RSVP
- Earth System Modeling at the National Theatre (Wednesday 23 February, 18:00 - 19:00) - optional, requires a ticket that the program will purchase if you are interested in attending
- Spring Break Travel Plans
March
- A Mole in London: Tunnelling Beneath the City, lecture at the Royal Geological Society (Wednesday 16 March, 17:30 - 20:00) - optional, requires RSVP
- Clybourne Park at Wyndham's Theatre (Wednesday 23 March)
April
- Education Program at the Globe Theatre (Monday 4 April, 14:00 - 15:30)
- Bath (Friday-Sunday 8-10 April)
- The Anthropocene: Living in a New Age, lecture at the Royal Geological Society (Wednesday 20 April, 17:30 - 20:00) - optional, requires RSVP
- Hamlet at the Globe Theatre (Saturday 23 April)
Science, Technology and Society
Class
Labs
Other
- Tech Tips
- Milestones, Techniques and Themes
- Syllabus
- General Education Rational
- Random Items that came-up in class, on an excursion, etc.
- Class Feedback Survey (SurveyMonkey)
Mashups
- Where we live and work.
- Where we have visited.
Science, Technology and Society - Syllabus
- CS-282, England Program, Spring 2011
- Charlie Peck, charliep at cs dot earlham dot edu
- Andrew Fitz Gibbon (teaching assistant), fitz at cs dot earlham dot edu
Overview
There is a long history of advances in science and technology shaping the development of human societies. The pace of change driven by technological and scientific advances continues to increase, to the point where those advances are now the defining feature of modern life. This course will examine some of the major milestones of science and discovery and their effects on human societies.
We'll consider the principle discoveries and developments in a wide range of natural science and allied disciplines over the past 300 years or so. As part of this we'll examine the changes those developments and discoveries engendered in society. With this historical context we'll then consider what scientific and technological developments the (relatively near) future may bring and what their effects on human society might be. We'll also look at how society drives science and scientific discovery through Citizen Science projects.
England was the location of many of the important scientific advances we'll examine, London is also one of the places with a concentration of people that think and write about the future of science, technology and society.
The bulk of the work for this course will be reading, discussion, labs, and writing assignments. There will be some lectures but not large quantities of them. This is a four credit course, we'll meet twice a week for 2 hours each plus about four field trips. Some of the other trips we'll take during the program will include small components of material related to this class as well. Science and technology are all around us, we'll leverage that during this class.
This course fulfills the non--lab Scientific Inquiry and Quantitative Reasoning general education requirements.
Materials
There are two texts for this course:
- Robert Hazen and James Trefil, Science Matters , Anchor; Reprint edition (June 2, 2009), ISBN-13: 978-0307454584
- Rudi Volti, Society and Technological Change , Worth Publishers; Sixth Edition edition (March 6, 2009), ISBN-13: 978-1429221214
I expect that you will have acquired these books before arriving in London in January. Both are readily available from e.g. Amazon. Be sure you have the correct editions of both texts.
We'll also read articles or chapters written by some of the following people:
- Alvin Toffler
- Richard Dawkins
- Rachel Carson
- Bill Bryson
- Malcolm Gladwell
- Ray Kurzweil
- Howard Rheingold
I will provide you with copies of these at the appropriate times.
Field Trips
As part of this course we'll visit a number of places related to the history of science and technology in England. Darwin's home, the site of the first mashup, and the Royal Observatory in Greenwich among them. These trips will be done in the context of our readings and labs, e.g. when we visit Greenwich we'll work on a lab that incorporates the measurement of time and distance, building on Harrison's work to develop a method for determining longitude.
Assignments
There will be four types of assignments for this class: readings, exercises, labs, and writing.
Readings
We'll have regular reading assignments from the texts and from the other sources listed above. We'll discuss those readings as part of our class meetings and during our field trips.
Exercises
Periodically we will work on exercises related to the readings, most of these will require you to learn about particular scientific or technological concepts and demonstrate a basic understanding of them.
Labs
In order to learn how science is practiced and the strengths and weaknesses of the scientific method this course will incorporate a number of labs. Given that we'll have somewhat limited facilities and equipment these will typically involve using fairly basic tools, but as you will see it is possible to do a significant amount of science without sophisticated laboratories and instruments.
Journals
Each week I'll ask a question or two about the material we're covering and ask you to respond in an on--line journal. I'll provide you with a web--based mechanism for these journals so that it's easy for you to write them and for me to read them without the hassle of printing them on paper.
Term paper
During the second half of the semester each of you will choose a topic, either from a list I provide or of your own choosing (vetted by me), to research and write a 8--10 page paper about. I will give you a fair amount of latitude when choosing a topic as long as it's within the bounds of the material we are covering for the course. This will be a survey paper, which assumes a lay audience.
Evaluation
Your grade for this class will be determined using the following rubric:
- Exercises - 25%
- Labs - 25%
- Journal - 15%
- Term paper - 20%
- Class participation - 15%
My definition of class participation is showing-up, doing the work, and actively engaging your fellow students and myself in the enterprise of learning.
Disabilities
Please let me know as early in the semester as possible if there are any adaptations or accommodations you require, if there is any emergency medical information I should know about, or if you might need special arrangements in the case the building needs to be evacuated, etc . The Earlham policy is:
- Any student with a documented disability (e.g., physical, learning, psychiatric, vision, hearing, etc.) who needs to arrange reasonable accommodations must contact Academic Support Services and the instructor at the beginning of each semester. Accommodation arrangements must be made during the first-two weeks of the semester.
It is important to follow this procedure.
Assignments
Due Friday 25 February
- Write-up due, Lab 2: Holy Pigeon P#$! Batman, it's Penelope Poison!.
Due Sunday 20 February
- Data collection for Lab 2: Holy Pigeon P#$! Batman, it's Penelope Poison!, 11:00 - 19:00 (with dinner at the flat).
Due Saturday 19 February
- All previously assigned questions, journal entries, etc. are due by the end of the day. This is your last chance to catch-up on the work for the first part of the semester.
Due Friday 18 February
- Read chapter 10 (Astronomy) and chapter 11 (The Cosmos) in Science Matters.
- Develop at least 3 questions about concepts, technologies, etc. that didn't stick from the reading in chapters 10 and 11. Post these to your wiki journal in an entry titled Astronomy and the Cosmos.
Due Thursday 17 February
- Write-up a critique of the Technology and Sustainability lecture you attended on Wednesday evening. Content, structure, etc. are all fair game. Post this in your wiki journal in an entry titled Technology and Sustainability Talk.
Due Tuesday 15 February
- Following our visit to Kew Gardens, consider the following questions and write-up your response in a wiki journal entry titled Science at Kew:
- What science do they do at Kew? What evidence of scientific underpinnings did you find in the displays? Why is it important to society, that is why should society support the work Kew does? What are the principle near-term and long-term benefits that are likely to accrue from their work? Another way to ask this question is who benefits from their research and why? (Hint, they provide good information about these topics in their exhibits and on-line materials.)
- Bonus question (5 points) - Identify as many places as you can at Kew where you encounter the Fibonacci sequence (Wikipedia). List these in a wiki journal entry tittled Fibonacci at Kew. There is a very nice bit done by the BBC on the Fibonacci sequence here.
Due Monday 14 February
- Write a short review of Greenland and post it in your journal on the wiki. Consider the accuracy of the information presented and the effectiveness of that medium, and that particular play, as a tools for shaping public opinion about climate change, clearly label this entry Greenland Review.
- Reflect on what you learned over the past couple of weeks about climate change and consider the questions below. Write-up your thoughts about all this in your journal on the wiki, clearly label this entry Reflections on Climate Change.
- What do you believe the take-away message to be?
- Which of the modalities did you find most effective at communicating that message: reading, museum, or theatre? Why?
- What's different about the message here in England than what you hear in your home country about climate change? Different than at Earlham?
Due Friday 11 February
- Greenland at the National Theatre, see the page for the details.
- Before the play listen to a segment from This American Life about climate change and public opinion about it. This segment is embedded in a show called Kid Politics, the segment you should listen to is Act 2, Climates Change, People Don't, begins at 24:27.
Due Tuesday 8 February
- Read chapter 4 (The Atom) in Science Matters.
- Develop at least 3 questions written or emailed to me before class about concepts, technologies, etc. that didn't stick from the reading in chapter 4.
Due Monday 7 February
- Teach yourself a couple of new MediaWiki formatting commands. Using the edit link (at the top of the page) to view the source of say a Wikipedia page that does something you think is cool is a great way to learn how to use the markup language. Just press the Cancel link (at the bottom of the page) when you are done.
- Consider your first experience at Atmosphere in light of the questions listed below. Write-up your thoughts in your journal on the wiki, clearly label this entry Atmosphere I. This entry should reflect some of your new found skills from item 1. above.
- Which specific aspects of climate change did the designers of atmosphere choose to focus on?
- How well sourced was the science and technology discussed in the kiosks?
- What was the most surprising thing you learned?
- Which of the interactive kiosks did you find most engaging? Why?
- Which of the interactive kiosks did you find least engaging? Why?
Due Saturday 5 February
- Write-up due, Lab 1: Where Am I?. Send me email when it's done so I know when I can review it.
Due Tuesday 1 February
- Read chapter 14 (Earth Cycles) and chapter 19 (Ecosystems) in Science Matters. Come to class on Tuesday with 3 or more written or emailed to me before class questions about the material.
Due Monday 31 January
- Start work on the write-up for Lab 1: Where Am I?, come to class with questions, etc.
Saturday 29 January
- Greenwich excursion, field work for Lab 1: Where Am I?
Due Friday 28 January
- First written responses in your wiki-based journal due, the question to address is:
In your view what are the three most important challenges facing society in the near term (say 50 years)? Why are each of these so important? What does science have to offer for each? What does technology have to offer for each? Your entry should clearly address which are science based and which are technology based. You can describe both science and technology approaches for each of the problems you identify.
- You can find your wiki-based journals for this class here
Due Tuesday 25 January
- Read the pages listed under Greenwich on the Supplemental Material page
- Come to class with any questions you have about what they cover, the implications, etc.
Due Monday 24 January
- Read Chapter 2 (Energy) in Science Matters.
- Come to class with a written list of questions about concepts, etc. that didn't stick from chapters 1 and 2.
Due Tuesday 17 January
- Read Henry Petroski's short article about science and technology which can be found on the Supplemental Material page
Due Monday 16 January
- Read the Introduction and Chapter 1 (Knowing) in Science Matters.
Due Tuesday 11 January
- If you haven't completed the reading for Monday do so now.
Due Monday 10 January
- Read the syllabus and general education rational, come to class with questions, etc.
Lab 1: Where Am I?
Overview
There are lots of interesting and historic places in Greenwich, there are also some places that are fairly ordinary. Working in your lab groups (see below) you will locate one such ordinary place, determine where it is a couple of different ways, measure the shortest distance from that point to the Prime Meridian, and note some additional physical markers.
Figuring-out where you are and how far it is to other things is the first step in mapping the world around us. This lab is designed to give you first-hand experience with some of the tools and processes to do that measuring and mapping.
Once you have completed the data collection in Greenwich you and your lab partners will analyze the data and describe the results in a lab report which will be due next week.
Make sure that at least one person in each lab group brings a laptop with them to Greenwich. It will make some aspects of the lab much easier. If you have a minute to install Google Earth before tomorrow that would be even better.
Lab Groups
Listed below are your scientifically chosen lab groups along with a description of the fairly ordinary place you will need to locate.
- Red: Lily, Bill, Emily - The steps leading from the sidewalk to the front entrance of the Our Lady Star of the Sea church.
- Green: Krystnell, Johanna, Spencer - The intersection of May's Buildings Mews and May's Court.
- Yellow: Mamus, Ivan, Vivian - The distal end of Croom's Hill Grove.
- Black: Eva, Gillian - The steps leading from the sidewalk into the courtyard of the museum devoted to cooling oneself.
- Purple: McKayla, Ben - On the sidewalk near the marque of the home of Greenwich's thespians.
Details
Once you have located your spot you will need to:
- Determine the latitude at that spot using at least three different tools/methods.
- Determine the longitude at that spot using at least three different tools/methods.
- Determine the elevation at that spot using at least three different tools/methods.
- What is due North of that spot? (E.g. "a house with blue shutters", or "an oncoming car...")
- What is due South of that spot?
- Determine the minimum distance in meters from that spot to the Prime Meridian using at least two different tools/methods.
Hint: There is a really big, sort of blue/green, local reference point for elevation running alongside Greenwich.
Tools and Methods
There are a number of different ways you can determine latitude, longitude, elevation and distance:
- A well reasoned and reasonably accurate estimate.
- Measuring by angle of elevation and distance.
- Measuring by calibrated human pace.
- GPS device (I have two to loan for 1 hour time blocks on Saturday when we're in Greenwich)
- Google Earth
Each of these tools has their own strengths and weaknesses, sources of error, etc. One aspect of this lab is to learn what they are and how to best work with them. At least one person in each group will need to install Google Earth on their laptop.
Note that not all of the tools/methods need to be employed while you are in Greenwich, that is once you have a handle on the spot you could sit at FIE and use Google Earth. All of the other tools/methods require your physical presence at the spot to employ them.
Report
Each group will write-up a lab report in the Lab Notebooks section. There is a very simple template there for each group to start with. Your write-up should include:
- A description of the task at hand and your approach to the work.
- A description of the spot you are working from.
- The measurements as listed under Details above, for each of the tools/methods, organized in tabular form.
- A discussion of the sources of error associated with each of the tools/methods you employed and the likely range into which the correct answer is likely to fall for each of them.
- The raw data, that is each value read (at minimum 3 values for each data point) for each tool/method you employ for a given measurement.
Extra Credit: A basic visualization which utilizes an aerial image with a placemark at the spot, labeled with the coordinates, and visual indications of the "zone of error" for each of the tools/methods you employed.
Neatness and organization count, significantly.
Questions
Once you folks begin working on the lab I will be available to answer questions, loan tools, make smart remarks, etc. You can find me at roughly 51.4816 -0.0099, probably drinking coffee.
Lab 2: Holy Pigeon P#$@ Batman, it's Penelope Poison!
Overview
London is in a pickle, and it is your job to help them out of it. The notorious Penelope Poison has threatened to release a toxic substance into London's water supply, in order to thwart her plan the emergency response people need visualizations which show the water temperature, air temperature and wind speed and direction at a number of water bodies located in central London.
You will all need to show-up at location 1 (see Questions below) before/at 11:00 on Sunday morning. I will be available starting at 9:30 at that location to hand-out instruments, answer questions, etc. At least one person from each group should plan on being there before 11:00. I will be leaving that location at 11:15 sharp so stragglers will need to hope their group waits for them.
There are lots of important details embedded in this lab description, reading it closely and carefully will be worth the time.
Lab Groups
Listed below are your scientifically chosen lab groups:
- Red: Lily, Bill, Emily, Ben
- Yellow: Mamus, Ivan, Vivian, Eva
- Green: Krystnell, Johanna, Spencer, McKayla, Gillian
Details
Just before the Director of Emergency Response (Mr B. Cheese) left town for an undisclosed location he took pictures of the locations that need to be sampled, you can find them at http://cs.earlham.edu/~charliep/EnglandProgram/Lab2. Unfortunately he was in a rush and neglected to label any of the pictures.
- Identify where each of the 11 images were taken. Remember that digital images often contain more information than meets the eye.
- At each of those 11 locations record the following:
- A picture that duplicates as near as possible the one you were given of that location.
- The latitude, longitude and elevation of the location (if you have a GPS in your kit use that, if not use Google Earth).
- An estimate of the wind direction and speed at that location when you are there.
- The temperature of the water body in the picture at that location.
- The air temperature when standing where the image was taken at that location.
Remember to record at least three readings for each parameter at each location. Later you can aggregate each of those groups of three readings into a measurement of that parameter for that location. Think about how to "reset" each instrument so you can record three independent readings of each parameter.
Google Earth is a tool just like the physical ones, when you use it to measure e.g. the latitude/longitude/altitude you should develop and document a procedure for taking three readings just as you are for the other tools.
To measure the wind speed you can estimate it using the Beaufort scale. The wind direction can be determined with a small scrap of paper and a compass or GPS in compass mode.
Measuring the air temperature will depend on which kit you have. The thermocouple and the combination compass/thermometer can take direct readings, the infrared thermometer will require a little cleverness to enable it to measure the air temperature.
Each group must make their own measurements, this will enable the emergency responders to compare the values obtained with different instruments and people to ensure that they react properly. You can share techniques and ideas among your groups but not data.
Each of these tools has their own strengths and weaknesses, sources of error, etc. One aspect of this lab is to learn what they are and how to best work with them. At least one person in each group will need to install Google Earth on their laptop.
Normally you would take air and water samples at each location as well, since Penelope Poison is threatening to act soon you don't have time for that now.
Red Instrument Kit
- Combination compass/thermometer
- Uni-T multimeter with point contact temperature probe
Yellow Instrument Kit
- GPS
- Maplin thermocouple thermometer
- Compass
Green Instrument Kit
- GPS
- Infrared thermometer
- Compass
Report
Each group will write-up a lab report in the Lab Notebooks section. Your lab report should include the following elements:
- A description of the problem you were given and your approach to solving it.
- For each parameter the procedure you followed to obtain the readings and measurement.
- A tabular display of each measurement of each parameter at each location.
- An analysis of the measurements describing any patterns that are evident and your thoughts about why they might be present.
- A small/simple gallery of the images you took at each of the locations with descriptions of the actual place (e.g. Looking North from the South side of the fountain in Bethesda Terrace in Central Park).
- An appendix with the readings and measurements for each parameter and each location.
- For each of the instruments you used determine the error associated with it. If references are available for the instrument use those values (and document the source), if not make a reasonable estimate and document how you came to it.
- A visualization of the data, preferably as an overlay on a map or aerial image of the overall area in question.
- A short statement from each group member explaining what they contributed to this lab.
There is a very simple template there for each group to start with, you should not feel bound to the format that's there but you must be sure to address each of the items listed above.
Neatness and organization count, significantly.
Visualization
Each group will create a visualization with the parameters they measured. We'll discuss the different approaches to this over dinner on Sunday and in class on Monday.
Questions
Before you start and once you are working on the lab I will be available to answer questions, etc., here's where to find me when:
- Between 09:30 and 11:00 you can find me at roughly 51.510509, -0.127060
- Between 11:30 and 14:30 you can find me at roughly 51.502998, -0.165623
- After 15:00 you can find me at roughly 51.511393, -0.127091
I won't be checking email or text messages between 11:00 and 15:00 but I will be available for F2F consultation at the locations/times listed above.
Lab Notebooks
Lab 1: Where Am I?
Lab Write-up for Group Red
Albert Greene, Lilly Cutler, Emily Van Cise Lab One: Where Am I? Science, Technology, and Society 2/4/2011
Part one: Description and Method
We were charged with exploring the various means of identifying location, and by extension, navigation. To simplify our overall project, we were given a location within walking distance in the epitome of constructs, the prime meridian in Greenwich. Our task was, once provided with a location by our instructor, to identify the coordinates of this point using three different methods available in the modern era. Although humans have developed an impressive array of devices and methods with which to navigate, we chose to utilize three divergent tools. First and the most fundamental is general reason and understanding of the structure which serves as the foundation for the human enterprise of navigation. Our second method was to employ Global Positioning Satellite technology, better known as GPS. Finally, we used a program known as Google Earth, which generates a three dimensional simulation of the earth based on satellite images and computer modeling.
Our use of general logic incorporates a number of assumptions that reflect the fundamental design of latitude, longitude, directionality, elevation and space. We could deduce the latitude by noting that the city of London sits comfortably on the N51* mark, and further, that the Thames is around the 28 minuet mark. The location we were given sat half way between the ends of Greenwich Park, a mile long patch of grass. We could then claim that the latitude of our location was between points 0 and 1000. We determined longitude by measuring the step of one metric Bill whose pace is one meter per step. We counted the calibrated step to determine how far we were from the prime meridian which would give us the longitude. Objects north and south of us could be identified by noting that the sun rises in the east and sets in the west. Given the time, we could note its accent or decent and determine north and south relative to its location in the sky. Finally, given that the Thames is at mean sea level 0, and that the Greenwich observatory is 153 feet high, we could deuce our relative elevation to both points. After looking at our findings utilizing digital and satellite technology, it was surprising how accurate general reason was.
Global Positioning Satellites technology is relatively simple. Given a GPS, a devise that communicates with satellites above, we merely read off and record our location. The satellites, which are in orbit above the earth, cover a circular area and the devise finds our location by identifying the overlap of the areas covered. We were given latitude, longitude, elevation and could place landmarks. The devise can measure the distance between these two points and give us the length in meters.
Google Earth, a program which generates a “perfect” model of the earth is also an incredibly simple method for divining our location. We merely needed to find Greenwich via the search option, find our location specific spot, which was conveniently marked as a point of interest. Moving the cursor over the point would give us latitude, longitude and elevation. The program also includes a measure function and provides a wide array of measurements for points you place on the map. Using these three methods we were able to find out where the heck we were.
Part two: Description of Location
We were told to orient ourselves on the steps of Our Lady Star of the Sea Church (see below). A Catholic Church located on Crooms Hill Road in Greenwich, London. The road runs parallel to the Greenwich park grounds on the West side up a steep incline. Down the hill, to the north we saw a white house with metal guardrails on the roof. To the south, up the hill, we could see a red brick house with white trim just past a grassy noel. Across the street, toward the prime meridian was another incline fenced off by a metal gate and thick shrubbery. This barrier was a big reason for having a margin of error greater than ten meters with our measurement of calibrated stride. All that remains to be said at this point is that the area is lovely and that you can find more information on the church at http://www.portcities.org.uk/london/server/show/conMediaFile.5351/Our-Lady-Star-of-the-Sea-Church-Crooms-Hill-Greenwich.html.
Part Three: Tabulation of findings:
Latitude
GPS- N. 51 28.585 +/-5-6m
Google Earth- N 51. 28 349
Reason- N 51. 28. (000-1000)
Longitude
GPS- W. 000. 00 346 +/-5-6m
Google Earth- W 000 00. 352
Reason- W 000 00.360 +/-
Elevation
GPS- 37m
Google Earth- 37m
Reason- 38.25
Distance from Prime Meridian
GPS- 428 m
Google Earth- 417m
Reason- 360m
Part Four: A Discussion of Error
In terms of general logic we used our knowledge of location to determine our latitude. We already knew our approximate location. We generally guessed where we were, but were unable to know exactly where we were in terms of latitude, elevation, and longitude. We used a calibrated step, so this was not a perfect measure of distance. In terms of GPS, it is accurate up to five or six meters. So we know we were accurate up to five or six meters. In terms of Google Earth, the cursor placement could be relative and is not necessarily completely accurate with the location.
Part Five: Raw Data
GPS coordinates
Longitude W. 000. 00 346 +/-5-6m
Latitude N. 51 28.585 +/-5-6m
Elevation 38m
Distance from meridian: 428m
Google Earth
Longitude: W 000 00. 352
Latitude N 51. 28 349
Elevation 111 feet 37 m
Distance from prime meridian : 417m
General Logic
Latitude: N 51. 28. (000-1000)
Longitude: number of M. from meridian. W 000 00.360
Distance from meridian# of steps x 1 step360+- 15 steps
Average rate of bill+ 1 m
Elevation halfway up Cromwell hill from the Thames which is +5 m from sea level, 153 feet at top of hill, or 46m somewhere between 10 m probably 153 div 3=51 mult .75= 38.25 m above sea level
What is north: White house with metal guard rail on roof
What is south: red house on hill with white trim
Path taken during calibrated measurement march:
Reviewed - 21 February 2011
Lab Write-up for Group Green
Introduction
Description of task and approach
Despite being a completely arbitrary line, the prime meridian holds a great deal of significance for human navigation. During our visit to Greenwich, we used the prime meridian as a reference point for our assigned location. We estimated the latitude, longitude and elevation of the given spot using a GPS, a compass and human estimation. We used footsteps to determine our distance from the Royal Observatory as well as labels on a nearby lamppost.
Description of the spot
For this lab, we were directed to find the corner/intersection of May's Buildings Mews and May's Court. Quickly, we recognized (both through googlemaps and observations of the human eye) that our location was approximately on the same latitude as the Royal Observatory. Our estimate was that we were located 25 m South of the Royal Observatory’s latitude. We first took a description of what was directly North of our location. Standing on May’s Buildings Mews (a brown loose gravel road/driveway) we used a compass to look North and noted a black gate reading “The Grange”, on one side in stone, and “52 Mays Buildings Mews”, on the other side of the gate. Turning around 180° we now took observations of the location directly South of our location. In this direction ran May’s Court North to South. Along this short road were several residential homes identified as “Beaver’s Housing Society”. More directly South of our location was the front yard and the birdfeeder. Looking to the East we identified a lamppost with elevation and longitude markings. We estimated this lamppost to be about 25 meters east of our location, and it proved instrumental in many of our ‘Human Estimations’.
Data Collection
Measurements & Raw data(raw data in bold)
1) LATITUDE:
Method 1 [Human Estimation]
royal observatory (51° 28’38.56”) – 25 m = 51.47737777766666° – (25m / 111248.24m) = 51.477153055010373°N
(lengths of degree latitude at 51° = 111248.24m)
Method 2 [GPS]
51° 28.633’ = 51° + (28.633 / 60) = 51.477216666°N
Method 3 [GoogleEarth]
51°28'37.82"N = 51° + ((28 + (37.82 / 60)) / 60) = 51.4771722222°N
2) LONGITUDE:
Method 1 [Human estimation/lightpole]
0° 0.381’ + 21 m = 0.00635° + (21 m / 70,197.65m) = 0.00664915°W
(length of degree longitude at latitude 51° = 70,197.65m)
Method 2 [GPS]
0° 0.372’ = 0° + (0.372 / 60) = 0.0062°W
Method 3 [GoogleEarth]
0° 0'22.42"W = 0° + ((0 + (22.42 / 60)) / 60) = 0.0062277777°)
3) ELEVATION:
Method 1 [Human estimation/lightpole] – 13 m
Method 2 [GPS] – 14 m
Method 3 [GoogleEarth] – 22 m
4) DUE NORTH:
A black gate and driveway for number 52 Mays Buildings Mews (written in stone next to the gate says “The Grange”)
5) DUE SOUTH:
Mays Court…and a housing complex called Beaver’s Housing Society…more specifically the birdfeeder in the front lawn
6) SHORTEST DISTANCE FROM PRIME MERIDIAN:
Method 1 [Human Pace]
184 paces (estimated at .5 m/pace) X 2 = 184 m
Method 2 [GoogleEarth]
432.3 m
Data Analysis
Discussions of sources of error
Sources of error made during data collection can be attributed to several factors. In choosing to use Johanna's footsteps to measure distance, we realized that we had no way exact way of ensuring that each footstep was equal to the next. The circumference of Spencer's wheelchair would have been more exact, and originally we found that circumference (using the tiles in the TexMex restaurant) to be two meters. Our first objective was to measure the distance between the spot of our location and the nearest lamppost. That alone was quite a tedious challenge using Spencer's wheelchair as it proved very difficult to follow the exact amount of wheel rotations. The group decided that it would be an inefficient use of time to attempt this method in measuring our distance from the Royal Observatory. Our next solution was to figure out Johanna's pace. Knowing the circumference of Spencer's wheel we compared one rotation to two of Johanna's steps. It took her four steps to go the exact same distance as a whole rotation, therefore it was estimated that one step was equal to 1/2 a meter. Although we are confident in this estimation we cannot be as confident in the consistency of Johanna's steps and therefore the human estimation involved in "Longitude", "Latitude", and "Distance from Prime Meridian" must account for a certain level of error.
Furthermore, when calculating the "Latitude" and "Distance from Prime Meridian" we noticed that we were extremely close, but not exactly, to the same latitude as the Royal Observatory. Using and eyeball estimation we attempted to walk a parallel line to the Prime Meridian from our location to the spot lying on the same latitude as the Royal Observatory (also using a compass to ensure East remained in the same general direction). Again with Johanna's pace this estimate came out as 25m (accounting for possible error in our human estimation on "Latitude" as explained above). From this location (noting the GPS longitude coordinate remained the same as our initial location) we decided an accurate measure of our distance from the Prime Meridian could be found by estimating the distance between us and the Royal Observatory. A number of sources of error occurred in this process. It would be a severe physical challenge to walk from this location directly to the Royal Observatory because of the path leads up the hill, not to mention that a measurement of Johanna's pace up the hill would be an inaccurate measurement of the actual distance since it would include a vast change in elevation. Our solution was to make a human estimation of a halfway point between the two locations, measure the distance between our current location and there, and then double that measurement. Obviously, our estimated halfway point was recorded through no more than the human eye and accounts for some of the possible error. Also, while walking to this point, we ran into a wall, stopped counting the pace while we walked perpendicular to our path until coming to an entrance to the park, where we again continued along our path and pace measurement. This pause in our measurement could also be the cause of some of the inaccuracies.
It is also possible that the degree of error associated with the GPS system and the satellites that it corresponds with is an issue which also may have affected the data points we obtained. When analyzing the results given by 'Google Earth' we looked for 0 degrees longitude and noticed that the spot it directed us to on the map did not appear to run through the Royal Observatory but a significant distance to the East of the Royal Observatory. This peaked our interest and with some basic research on wikipedia we discovered that a GPS will not indicate 0 at the Royal Observatory because GPS' operate according to a "GPS Prime Meridian" that is actually located approximately 100 meters east of the Royal Observatory. This is actually the Prime Meridian used by the International Earth Rotation and Reference Systems Service (identified in this context as the IERS Rference Meridian) specifically because it is the GPS Prime Meridian as identified by the United States Department of Defense. It is the current reference point for WSG84 (World Geodetic System 1984). Ironically, wikipedia identifies 2010 as the year in which WSG84 will no longer be valid after 2010. Anyways, the IRM or GPM is 5.31 arcseconds east of the meridian circle at the latitude of the Royal Observatory (specifically, 102.5 meters). Interestingly enough, this difference is attributed the legacy left behind by the TRANSIT, the first satellite navigational system. The TRANSIT surveyed coordinates in a non-Earth centered ellipsoid, yet has used those coordinates in Earth-centered ellipsoids, accounting for the differences. This helps to explain the source of error presented when using the GPS.
From everything we can tell, GoogleEarth appears to be the most accurate. However, we are not experts in using the program and it too could present inaccuracies. For instance, many of the coordinates it provides depends on the very specific location of the cursor. Try as we might, we cannot say with complete certainty that our cursor was on the exact locations we desired. One question we are left with deals with the elevation GoogleEarth provided. Our "human estimation" was based off of the lamppost nearby which read 13m. We felt our location on the same elevation as this lamppost, and the GPS helped validate that estimate by showing 14m. However, GoogleEarth identified the elevation at our location as 22m, which is a large enough difference to question it as a source of error.
Results
Reviewed - 21 February 2011
Lab Write-up for Group Yellow
Group Report 1: Where am I? Yellow team: Ivan, Mamus, and Vivian.
Our focus point was the distal end of Croom’s Hill Groove. We used three different methods/approach to identify our destination which includes Google earth, GPS and method of estimated (natural way). We used the GPS, Google earth, proximate measures, timer, camera and a compass as our tools. Below is a description of our identification by the use of longitude, latitude, elevation and distance.
Latitude: GPS reading: 51.47728 Google earth: 51.477543 Estimation:
PICTURE 1
Using Google Earth, we measured the distance from to the Equator to the closest approximate point to Croom’s Hill, Greenwich England. At this point we then used general knowledge (with a little help from Google) to establish the distance from the Earth’s core to the surface. Using the Pythagorean Theorem, we found the angle between AB and AC, which represents the an estimation of latitude for the purposes of this experiment.
In the diagram, a= 3441.58 miles (distance from Equator to Greenwich, England b=3975 miles (distance from Earth’s center to its surface) c= side needed in order to complete equation finding angle of latitude.
c =sqr(1915^2 + 3975^2 c =5257.860…
Finding A
A=sin(a/c) A= sin(3441.58/5257.86) A=.inverse of sin (.608) A=37.45° Therefore the angle of latitude using estimation is 37.45°.
Longitude: GPS: 00.000765 Google earth: 00.007876 Estimation: For every 15 ° of longitude, there is a 60 mins difference in time. We were 8 minutes away from the prime meridian of 0°, so our calculation of the longitude degree was as follows: 15°=60mins ???=8mins (15*60)/8 2°
Elevation: GPS: 18.5 ft but we changed this to 60ft through computer calculator. Google earth: 59 ft Estimation: By the natural arm method, we estimated the angle from Greenwich to our destination to be 60°. As shown on the triangle below we used the cosine and Pythagorean theory to find our elevation.
PICTURE 2
AC/BC= Cos a°
60ft/BC=Cos60°
BC= 60Cos60°
BC=60(0.5)
BC=30ft
a2+b2=c2
602+302=c2
3600+90=c2
?4500=c
C=67.08ft (our angle of elevation)
Distance:
Google earth: 540m
Estimation:
We used Ivan’s feet which we approximated to be 1 step is equivalent to 1 meter. Evan walked 10 steps in 07:48sec, which we approximated to be 8secs, so it takes one person to walk 10meters in 8 secs. We walked from our point (Croom’s Hill Grove) to in approximately 8 mins. So below are the calculations of the distance it took us from our point to the prime meridian.
10meter=8seconds ???=480seconds (8*60) (10m*480s)/8s = 675m
Below are pictures of the North aside and a description.
North side description: Narrow road Houses in form of flats with tiles on the roof Cars parked on the right side of the street, near houses.
PICTURE 3
South side description: A garden Garbage Dead end with a small/shallow wall.
PICTURE 4
Weaknesses:
Time was not accurate, as it depends on ones pace of walking, the answer (time it took us to walk) could vary depending on one’s speed.
The GPS is not as accurate. Their accuracy will be within about 10 to 50 feet (3 to 15 meters), 95% of the time.
Reviewed - 21 February 2011
Lab Write-up for Group Black
Introduction
Our task was to estimate and determine the distance between the Fan Museum, at 12 Croom's Hill, London SE10 8ER 020 8305 1441, and the Prim Meridian, to find the latitude, longitude, and elevation, and determine the surroundings of the Museum (what was north and south of it). Our approach to these tasks utilized a GPS, a compass, a scarf, Charlie’s angle finder, Google Earth and Google Maps. While on location, we walked the distance from point A to point B once with the GPS and a second time using a scarf as a measuring device (the scarf was not a accurate as the our other means of measurement). In Greenwich we also looked at the surrounding area (N and S), looked at the street poles to find the longitude and latitude and used the angle finding device to find the elevation of our museum from sea level.
The location from which we were working was in a quiet part of town on a calm street where the Fan Museum was tucked away on the edge of a residential area.
Data Collection
Due North: Greenwich Theatre
Due South: Residential building
Distance between spot and prime meridian found by: Scarf, GPS, Google Earth
Data Analysis
It was hard to find the accurate distance between spot and prime meridian because the road we used to find the distance on was not a straight line and we were also faced with obstacles like a wall on our way therefore we had to go around the wall and that might have produced some errors in our calculations. We also went halfway and estimated the distance of the other half; this might not be accurate because our judgment of half way might not have been the real half way of the total distance we were measuring.
Results
1. GPS 2. Google Earth 3. lightpost
Latitude 1.N 51.28° 2.N 51.28° 3.N 51.28°
Longitude 1.0°00'28.83" 2.W 0°00'28.83" 3.W 0°00'28.83" W
Elevation 1. 13m 2. 13m 3. By estimation 13m
Reviewed - 21 February 2011
Lab Write-up for Group Purple
Introduction
Our task was to find the Latitude and Longitude of the Greenwich Theater using three different methods. We were also tasked with finding the elevation and distance to the Prime Meridian using two different methods, and what was due south and North of the location. Here is the methods we used to find the information.
- Latitude
- Google Earth
- Reasonable Guess
- Using a picture taken off Google Earth with two known degrees of latitude, then estimating where our location lies between them
- GPS
- Longitude
- Google Earth
- Reasonable Guess
- Figure out the distance to the PM, convert the linear measurement to degrees longitude, then add or subtract that from the 0 degrees (The PM)
- GPS
- Elevation
- GPS
- Google Earth
- Distance to Prime Meridian
- Google Earth
- GPS track feature
- Due South
- Compass
- Due North
- Compass
The Greenwich Theater was located several hundred meters from the Thames and had its back to the Royal Naval College. While the theater itself is fairly large, we were only concerned with the front entrance which was a small awning overlooking a fairly quiet street. The Rose and Crown Pub was next door, which happened to be due North of the entrance. The Fan Museum was due South.
Data Collection
- Latitude
- Google Earth:57.469377
- Reasonable Guess:57.45
- GPS: 51.47937
- Longitude
- Google Earth: -0.007924
- Reasonable Guess:-0.00171
- GPS: -0.00804
- Elevation
- GPS:10.05 M
- Google Earth: 13 M
- Distance to Prime Meridian
- Google Earth: 118 Meters
- GPS track feature:121 Meters
- Due South
- Fan Museum
- Due North
- Rose and Crown Pub
Data Analysis
- GPS - according to the Garmin website, our GPS, the Etrex Vista C, is accurate within 30 meters 95% of the time. After importing our points to Google Earth, it looks like our points are within a tighter range. If the GPS has been calibrated, it is supposed to calculate the elevation within 3 meters of accuracy.
- Google Earth - Google Earth's elevation is typically within +_ 10 meters. We were unable to find out the accuracy of the latitude and Longitude settings, however they do offer a disclaimer say it is not accurate navigation. Several websites claimed that it is hard for Google Earth to be accurate due to how they map the area and how they stitch the various photos together.
- Reasonable Guess - this was not very accurate, especially when we did the calculations using the distance from the PM converted to degrees to calculate the Longitude.
- Compass - This was very accurate because we were looking at big targets. For instance, the Rose and Crown pub, situated five meters away occupied several degrees away from due North, so even if were were significantly off we would still have come up with the same result.
Results
Using a variety of methods we were able to return a variety of results. Generally the newer the technology the better it was. Obviously our guesses lacked the accuracy of the GPS and Google Earth. Interestingly enough, Google Earth is not noted for its accuracy for a variety of reasons including updates in the software used to stitch it together. The GPS was the only tool with readily available data on its accuracy and it did not turn out to be that precise. We do not have any raw data, we will make sure to collect it in the future.
Extra Credit
File:Earthlab.pdf Extra Credit
Reviewed - 21 February 2011
Lab Write-up for the Orange Group (Charlie)
- 22 February 2011
- N.B. - I did not collect any data or do any of the work described below, it's purely an example of one way to write-up a lab report. The procedures, error analysis and such are accurate, just the data has been faked.
Overview
Greenwich, England is home to the Prime Meridian, the arbitrary line that signifies 0 degree longitude for global navigation. The lab assignment, Where am I?, asks us to determine where a particular location in Greenwich is located using different tools/methods to determine the latitude, longitude, elevation and distance to the Prime Meridian of that location.
Data Collection
The spot I was assigned was just outside the Starbucks in Greenwich:
The lab instructions specify that we should use three different tools/methods to determine the latitude, longitude and elevation. Listed below are the choices I made:
- Latitude - GPS, Google Earth, and estimation
- Longitude - GPS, Google Earth, and estimation
- Elevation - GPS, Google Earth, and estimation
Next the instructions ask us to determine what is due North and due South of that location:
- North - compass and visual observation
- South - compass and visual observation
Lastly the instructions ask us to determine the distance from that spot to the Prime Meridian using two different tools/methods, I used Google Earth and estimation for this quantity.
Equipment and Procedures
- Garmin etrex handheld consumer GPS unit, software version 3.5.0
- Using the GPS involves powering it on, waiting for it to acquire enough satellite signals, noting the margin of error, and then switching the mode to waypoint which displays the latitude, longitude, and elevation. To obtain three readings I slowly spun in a full circle while chanting "umm" and then stopped and waited for the GPS to produce a new reading.
- Google Earth software, version 6.0.1.2032 (beta), running under OSX 10.6.6
- Once Google Earth is launched you can enter the location of interest in the search box and then zoom-in to the appropriate magnification for the task at hand. To obtain three readings I moved the mouse around on the screen and then returned it to the point of interest and re-read the latitude, longitude and elevation from the status bar on the bottom of the screen.
- Estimation using a 48 year old white male American with a background in science and engineering
- For the latitude I used the lamp post across the street and noted the latitude marked on it.
- For the longitude I used the lamp post across the street and noted the longitude marked on it.
- For the elevation I used the lamp post across the street and noted the elevation marked on it.
- For the distance to the Prime Meridian I calculated my pace by walking the length of the Cutty Sark 3 times, averaging the number of paces, and then dividing the known LOA of 280' <ref>Cutty Sark</ref> by that value. Using this method my pace was determined to be 2.5'. Using the hand-held compass as a guide I walked a line due East from the spot to the Prime Meridian keeping track of the number of paces. I then reversed my direction and walked back to the spot following the same path. I averaged the number of paces from the two trips and then multiplied that value by 2.5' to obtain an estimate of the distance.
- Silva bog standard hand-held compass, circa 1975
- While holding the compass on the outstretched palm of your hand, and using the centering bubble to ensure that it's level, a reasonably accurate reading can be taken if you hold your head directly above the compass and look straight down.
Measurements for each dimension were determined by averaging the three readings together.
Sources of Error
There are many sources of error, built-in and human, when using navigation instruments such as those employed for this lab. Below is a discussion of those as they apply to each instrument.
- GPS - Each GPS system has built-in error which varies depending on the specific unit, the number of satellites which are "visible" in the sky, and other internal factors. The Garmin unit I used displayed the accuracy of measurements each time it powered-up and acquired satellites. Each time I used it in Greenwich it stated that it had 3m accuracy. Greenwich is also home to the GPS Meridian, the 0 degree longitude for the GPS system. This meridian lies approximately 100m East of the Prime Meridian <ref>Prime Meridian</ref> which can cause confusion when using a GPS to measure the distance from a given location to the Prime Meridian.
- Google Earth - It's difficult to determine exactly what the internal accuracy of Google Earth is, the variety of sources used for the imagery and the variety of resolutions further confound matters. According to the Resolution and Accuracy section of the Wikipedia article on Google Earth <ref>Google Earth - Resolution and Accuracy</ref> London's imagery is high resolution. When using Google Earth to determine latitude, etc. the largest source of error is probably in the positioning of the mouse pointer. Not all platforms support changing the pointer from the default hand which is difficult to use to with any precision to something like an arrow which would improve the precision.
- Compass - The user must hold the instrument level, manually account for declination (approximately -2°25' in London) <ref>Magnetic Declination Explanation</ref> and parallax in reading the instrument are the primary sources of error. Compared to the other sources of error the magnetic declination in London is insignificant.
- Estimation - It's difficult to walk at a consistent pace over more than a short distance, say a couple of hundred feet, finding a straight path between two points in a city such as Greenwich is also difficult. One often has to make a "jog", going North or South for a distance around a fence, etc. before continuing to travel East.
Results
| Dimension | Instrument | Measurement |
|---|---|---|
| Latitude | GPS | xx.xx +/- 3m |
| Google Earth | xx.xx +/- 3m | |
| Estimation | xx.xx +/- 3m | |
| Longitude | GPS | xx.xx +/- 3m |
| Google Earth | xx.xx +/- 3m | |
| Estimation | xx.xx +/- 3m | |
| Elevation | GPS | xx.xx +/- 3m |
| Google Earth | xx.xx +/- 3m | |
| Estimation | xx.xx +/- 3m |
Directly North of the location is the intersection of two roads.
Directly South of the location is something really interesting.
The distance to the Prime Meridian as determined by Google Earth is xx.xx +/- 10m, by estimation it is xx.xx +/- 20m.
Appendix A: Raw Data
| Dimension | Instrument | Reading 1 | Reading 2 | Reading 3 |
|---|---|---|---|---|
| Latitude | GPS | xx.xx | xx.xx | xx.xx |
| Google Earth | xx.xx | xx.xx | xx.xx | |
| Estimation | xx.xx | xx.xx | xx.xx | |
| Longitude | GPS | xx.xx | xx.xx | xx.xx |
| Google Earth | xx.xx | xx.xx | xx.xx | |
| Estimation | xx.xx | xx.xx | xx.xx | |
| Elevation | GPS | xx.xx | xx.xx | xx.xx |
| Google Earth | xx.xx | xx.xx | xx.xx | |
| Estimation | xx.xx | xx.xx | xx.xx |
| Dimension | Instrument | Reading 1 | Reading 2 | Reading 3 |
|---|---|---|---|---|
| Distance to Prime Meridian | Google Earth | xx.xx | xx.xx | xx.xx |
| Estimation | xx.xx | xx.xx | xx.xx |
References
<references />
Lab 2: Holy Pigeon P#$! Batman, it's Penelope Poison!
England-2011-lab2-red
Group 1: Ben Smith, Lily Cutler, Emily Van Cise, Albert Greene
Problem Description and Approach
For this lab we were given the task of locating various points identified in pictures provided to us. We were able to find the locations in the pictures though the use of a computer program that could read the embedded Longitude and Latitude in the images. At each location we were to take measurements of the following: ambient temperature, water temperature, wind speed and direction. We also needed to confirm the latitude, longitude, and altitude of the locations we visited.
Data Collection
To collect this information we used several methods, each with varying levels of accuracy. We used a Uni-T multimeter to measure ambient and water temperatures. The compass we were given gave us our orientation upon which we based wind direction. We dropped a leaf or watched Bill’s exhaled smoke. The Beaufort scale was used to determine the speed of the wind. We then used Google earth to check our latitude, longitude and altitude.
Data Analysis
Good news! Penelope Poison will likely not be successful in spreading poison because it is too cold and windy outside to allow the spread of the poison.
Error Analysis
Uni-T Device- The error in using this device is +/- 1% +3. Depending on how long we waited to receive the temperature reading there may have been some human error, also in how we recalibrated the device before taking the next reading.
Compass- The error of the compass was mainly human error based on how close to the actual location the compass was being held and the angle with which it was being held and the consistency to which it was held at this angle throughout the data collection.
Leaves- The error of using leaves to find out the direction of the wind is that not the same leaf was used every time and the wind speed of the locations may have varied based on the surroundings and landscape. If the leaves that we chose to drop in the wind were wet they may have been heavier and harder to blow and allowed for some error in the data for the wind direction.
Pictures- Our ability to mimic and recreate the pictures was flawed because of our inability to recognize the landmarks in the original pictures and our attempt to retake the photos. This was a human error.
Images
Appendix A: Raw Data
| Location A | Location B | Location C | Location D | Location E | Location F | Location G | Location H | Location I | Location J | Location K |
|---|
! scope="row" | Longitude 1 | -0.142664' | -0.147532' | -0.18197' | -0.131919' | -0.16976' | -0.160808' | -0.174759' | -0.12766' | -0.160074' | -0.138764' | -0.175849' |} ! scope="row" | Longitude 2 | -0.142663' | -0.147536' | -0.181971' | -0.131941' | -0.169744' | -0.160836' | -0.174752' | -0.127667' | -0.160078' | -0.138727' | -0.175881' |} ! scope="row" | Longitude 3 | -0.142663' | -0.147537' | -0.181972' | -0.131955' | -0.169737' | -0.160836' | -0.174743' | -0.127649' | -0.160064' | -0.138728' | -0.175883' |} ! scope="row" | Latitude 1 | 51.50286' | 51.52532' | 51.506391' | 51.503448' | 51.505966' | 51.527818' | 51.507294' | 51.508194' | 51.504419' | 51.501745' | 51.516659' |} ! scope="row" | Latitude 2 | 51.502863' | 51.525323' | 51.506392' | 51.503456' | 51.505966' | 51.527759' | 51.507298' | 51.508199' | 51.504413' | 51.501745' | 51.510665' |} ! scope="row" | Latitude 3 | 51.502862' | 51.525328' | 51.50639' | 51.503453' | 51.505954' | 51.527769' | 51.507292' | 51.508205' | 51.50443' | 51.501754' | 51.510668' |} ! scope="row" | Altitude 1 | 41 ft | 105 ft | 97 ft | 36 ft | 50 ft | 122 ft | 70 ft | 69 ft | 52 ft | | 75 ft |} |! scope="row" | Altitude 2 | 41 ft | 105 ft | 97 ft | 36 ft | 50 ft | 122 ft | 70 ft | 68 ft | 52 ft | | 75 ft |} |! scope="row" | Altitude 2 | 41 ft | 105 ft | 97 ft | 36 ft | 50 ft | 122 ft | 70 ft | 69 ft | 52 ft | | 75 ft |}
Appendix B: Visualization
File:Charts.pdf Our Charts
File:Chartdata.pdf The data behind the charts
Charlie, i know you want these embedded, but i cannot figure out how... I think it has something to do with the file type?
Appendix C: Who Did What
Bill: For this lab, I was the official temperature taker, reading off the ambient and water temperatures. I also played a role in writing the lab report, taking care of part one, two and my section in part nine. I also found the Latitude, Longitude and altitude for the data spread sheet.
Emily: For this lab, I took the pictures and did the copy-editing. I posted the images and the raw data tables.
Ben: I downloaded the pictures, figured out how to read / import the geo-coding into Google earth. Looked at the location and planned our route. Built a spread to sheet to make data entry easier, entered data. Helped navigate and kept us somewhat found. Did visualization.
Lily: For this lab, I took the wind directions and the directions that we were facing. I also did the write up of the error analysis.
England-2011-lab2-yellow
Mamus, Vivian, Eva & Ivan
We just have to do a short write up for the visualization part.
Even without it, it is very clear to understand :)
Problem Description and Approach
Our task as the Yellow Team was to collect data from various water bodies in order to gauge the possible effects of releasing a toxic substance into London’s water supply. Dr. Obfuscation only provided photographs of the 11 locations where Penelope Poison threatened to release these toxic substances. We needed to figure out the geographical coordinates (latitude and longitude) of these locations, measure the air and water temperature, our elevation and note the wind speed plus direction at the times we were at these locations. Most importantly, we needed to figure out what the most accurate approach to collecting this data was, and what if any flaws there were in collecting this data. Time was also a factor to keep in mind, so we decided to tackle the location not in alphabetical order, but in the order of their proximity to one another.
Data Collection
Latitude, Longitude and Elevation using an eTrex GPS navigator
In order to determine the latitude, longitude and the elevation we used a GPS navigator powered by AA batteries. After turning the device on, three minutes were allowed to pass before readings were taken from the device for the first time in order to give it enough time to recognize enough satellites in order to provide accurate readings. For the second reading, the GPS device was turned off and on again, with a two minute interval before announcing the readings on the screen. For the third reading, the same procedure was followed except an interval of one minute was allowed before recording the readings produced by the device.
Wind direction using a compass and Tesco plastic bag
We laid the compass on a flat surface ( someone's palm, on the ground, on the surface of a flat bench) to help us determine the direction (north, west, east and south) of the location of the water body,. Three of the group members would each stand parallel to the compass with the plastic bag on their hand and observe the direction of the wind.
Wind speed using the Beaufort Scale
Wind speed was collected using the Beaufort Scale, a standardized method using visual estimations of the effect of the wind on objects such as a Tesco plastic bag, body of water and tees. When using the plastic bag, it was important to make sure that it was completely unfolded and had no residue of any sort inside it. It was held on at an arms length for 30 seconds. The extent of movement by the plastic bag was then visualized against the description of the Beaufort and awarded a number that matched the images of water used on the wikipedia page to distinguish between different wind speeds. When observing the water, it was important to make sure that the observer watcher its surface for at least one minute in order to establish a steady rate of motion on the surface of the water as a result of the wind. Lastly, when observing the trees, it was important to watch one specific tree for one minute in order to establish the effect of the speed of the wind on the leaves. This was done at every location.
Air and Water Temperature using the Maplin thermocouple thermometer
In order to measure the temperature for the air and water we used the Maplin thermocoupla thermometer device provided to us by Charlie Peck. This device consists of a screen for taking readings, an on and off button, a hold button, and a small metal rod attached to a wire on the back of the device for taking temperature measurements. At each location we went to we took out the rod, turned on the device, left it on for two minutes and then took the reading, copied the temperature reading onto our data sheet, then turned off the device for one minute and repeated this process twice more copying the respective readings onto our notes. Then using the same tool we put the small rod into the water at each location, here it was important to make sure the rod was immersed significantly in the water, we left the rod for two minutes, removed it from the water and copied the temperature from the screen. We then dried off the rod waited one minute and repeated this process twice.
Finding places
Nowadays there is more data stored in a single photo than can be seen in the photo itself. Information including when the photo was taken and with what equipment the photo was taken is available in data stored within pictures. Some cameras even have GPS devices incorporated into their mechanics allowing them to store the coordinates of the location at which the photo was taken (geocoding). The pictures provided by Dr. Obfuscation contained information which contained coordinates which could be read and further integrated into satellite images on Google Earth using Picasa.
The picture below demonstrate the integration of the photos provided by Dr. Obfuscation and Google Earth, which enabled us to tactfully choose which locations to record date from first.
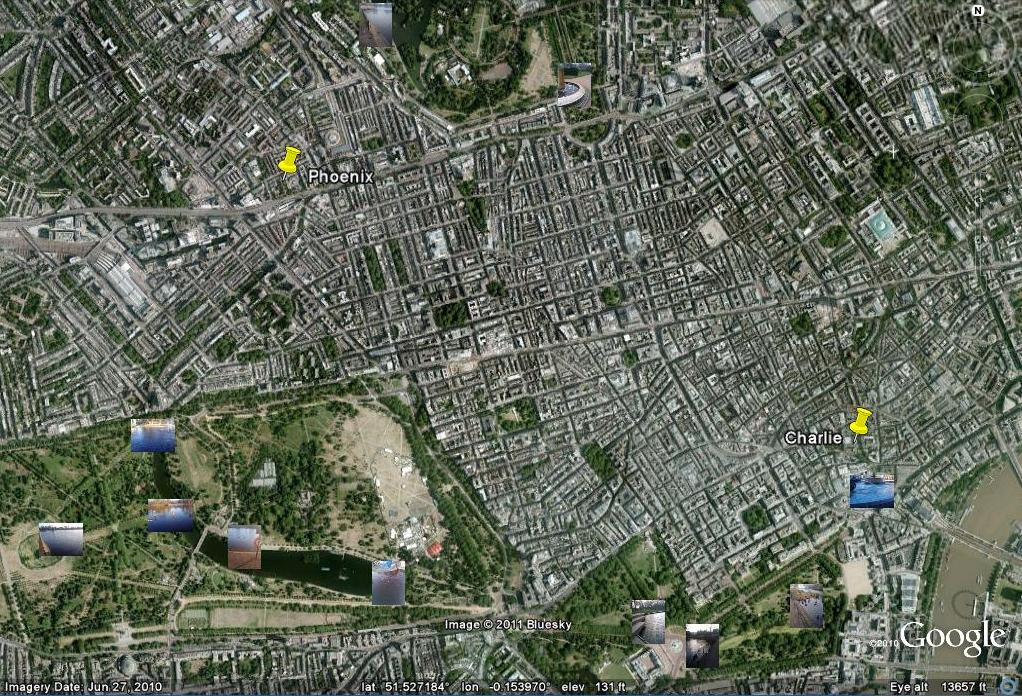
Error Analysis
Latitude, Longitude and Elevation
We checked on the Garmin website, the Etrex Vista C, is accurate within 30 meters and 95% of the time. Its accuracy and errors also largely depends on how many satellites it can find.
Wind Direction using a compass and Tesco plastic bag
It was hard having the compass on a flat surface in some areas as most readings were taken while it was on someone's palm ( a surface that is not even). In addition, regular compasses are not made to point exact North, but relative North which a point with a particularly strong magnetic pull. Therefore many of the objects we identified as being North or South of the water bodies might not have been so, if we were looking for a precise bearings. When experiencing light winds, a Tesco plastic bag might prove to be denser than the wind thus making it impossible to show which direction the wind is moving. Using objects that have a similar density to air, such as dyed smoke or cigarette smoke might be more efficient in showing much lighter winds.
Wind Speed using the Beaufort Scale
The primary error with using the Beaufort scale to measure wind speed is that every humans capacity to estimate the similarity of the effect of wind on an object that is not water (as was originally the case) is that everyone perception is different. When using the plastic bag,a source of era was its density. At times, when the force of wind speed was lesser than the density of the plastic bag, it failed to move this leading to the observatoon that there was no wind when in actual fact there might have been some movement at extremely low speeds. Secondly, when using the water as a means to estimate the wine speed, our method did not account for movement caused by other objects such as animals in the water body or man made objects such as paddle boats. This may have indicated that the wind speed was greater than was the actual case. Lastly with using the trees, a primary source of error was due to the season where most of the leaves haveel fallen out. Similar to the plastic bag, some winds might be too slow to cause movements among the branches of the tree- once again resulting in estimating wind speeds that might be slower than is the actual case.
Air and Water Temperature using the Maplin thermocouple thermometer
Sources of error that we experienced in collecting air and water temperature were both mechanical and human errors. Although we dried the rod after each reading the rod may still have been chilled which may have affected the results of the next air temperature reading. As far as documenting water temperatures we experienced problems with accuracy due to an inability in some locations to immerse the rod without it being in contact with stone. Also the varying depth of the bodies of water may have had some effect on the accuracy of the readings. In the manual of this device it is written that its error is +- 3%.
Images
Left photos are the one that we were given. And the photos that are on the right side are out reproduction of each and single photo. Under every set of photos there is a nice description about what is around. This is the order of them: c, g, h, k, a, b, e, j, f, d, i.
In addition, below is a link that will take you to the premier showing of the Yellow Team's first production (in the form of a slide show) of Holy Pigeon P#$@ Batman, it's Penelope Poison!. Accompanying each picture is a caption including what is North and South of the water body.
Appendix A: Raw Data & Data Analysis
| Location A | Location B | Location C | Location D | Location E | Location F | Location G | Location H | Location I | Location J | Location K | |
|---|---|---|---|---|---|---|---|---|---|---|---|
| Time Stamp | 12:03 | 02:32 | 3:30 | 11:45 | 12:52 | 02:11 | 03:08 | 03:20 | 12:28 | 11:54 | 02:59 |
| Water Temperature1 | 7 | 6 | 5 | 6 | 3 | 3 | 3 | 8 | 4 | 6 | 3 |
| Water Temperature 2 | 8 | 6 | 5 | 7 | 3 | 3 | 4 | 8 | 5 | 6 | 3 |
| Water Temperature 3 | 8 | 6 | 6 | 7 | 3 | 3 | 4 | 8 | 4 | 6 | 3 |
| Ambient Temperature 1 | 6 | 4 | 2 | 7 | 5 | 2 | 2 | 11 | 7 | 7 | 3 |
| Ambient Temperature 2 | 7 | 5 | 3 | 8 | 4 | 3 | 3 | 10 | 9 | 8 | 3 |
| Ambient Temperature 3 | 7 | 4 | 2 | 8 | 5 | 3 | 2 | 9 | 8 | 8 | 3 |
| Location: | Time | GPS Elevation | Air Temp | Water Temp | Wind Direction | Wind Speed | Latitude | Longitude |
|---|---|---|---|---|---|---|---|---|
| H | 11:35 | 59 ft | 8 °C | 7 °C | SE | ~1 | 51.50813° | 000.12798° |
| H | 49 ft | 7 °C | 7 °C | 51.50803° | 000.12762° | |||
| H | 55 ft | 10 °C | 7 °C | 51.50821° | 000.12753° | |||
| H average | 11:35 | 54.3 ft | 8.3 °C | 7.0 °C | SE | ~1 | 51.50812° | 000.12771° |
| D | 12:06 | 31 ft | 11 °C | 5 °C | S | ~1 | 51.50359° | 000.13118° |
| D | 36 ft | 10 °C | 5 °C | 51.50357° | 000.13223° | |||
| D | 49 ft | 5 °C | 5 °C | 51.50371° | 000.13227° | |||
| D average | 12:06 | 38.6 ft | 8.6 °C | 5.0 °C | S | ~1 | 51.50366° | 000.13189° |
| J | 12:25 | 36 ft | 7 °C | 5 °C | S | ~1 | 51.50191° | 000.13934° |
| J | 39 ft | 6 °C | 5 °C | 51.50209° | 000.13946° | |||
| J | 30 ft | 6 °C | 5 °C | 51.50178° | 000.13988° | |||
| J average | 12:25 | 35.0 ft | 6.3 °C | 5.6 °C | S | ~1 | 51.50192° | 000.13956° |
| A | 12:42 | 36 ft | 7 °C | 6 °C | SW | ~1 | 51.50290° | 000.14225° |
| A | 31 ft | 7 °C | 6 °C | 51.50292° | 000.14247° | |||
| A | 30 ft | 7 °C | 6 °C | 51.50288° | 000.14288° | |||
| A average | 12:42 | 32.3 ft | 7.0 °C | 6.0 °C | SW | ~1 | 51.50290° | 000.14253° |
| I | 13:25 | 42 ft | 6 °C | 5 °C | SW | ~1 | 51.50446° | 000.16004° |
| I | 50 ft | 6 °C | 5 °C | 51.50443° | 000.16006° | |||
| I | 45 ft | 6 °C | 5 °C | 51.50443° | 000.16007° | |||
| I average | 13:25 | 45.6 ft | 6.0 °C | 5.0 °C | SW | ~1 | 51.50444° | 000.16005° |
| E | 13:45 | 65 ft | 7 °C | 5 °C | SW | ~1 | 51.50598° | 000.16958° |
| E | 52 ft | 5 °C | 6 °C | 51.50597° | 000.16958° | |||
| E | 55 ft | 6 °C | 5 °C | 51.50597° | 000.16956° | |||
| E average | 13:45 | 57.3 ft | 6.0 °C | 5.3 °C | SW | ~1 | 51.50597° | 000.16957° |
| G | 13:55 | 72 ft | 5 °C | 6 °C | SW | ~1 | 51.50727° | 000.17469° |
| G | 70 ft | 5 °C | 5 °C | 51.50732° | 000.17467° | |||
| G | 70 ft | 6 °C | 6 °C | 51.50729° | 000.17469° | |||
| G average | 13:55 | 70.6 ft | 5.3 °C | 5.6 °C | SW | ~1 | 51.50729° | 000.17468° |
| K | 14:16 | 83 ft | 5 °C | 5 °C | SW | ~1 | 51.51070° | 000.17588° |
| K | 79 ft | 5 °C | 5 °C | 51.51070° | 000.17589° | |||
| K | 79 ft | 5 °C | 5 °C | 51.51067° | 000.17586° | |||
| K average | 14:16 | 80.3 ft | 5.0 °C | 5.0 °C | SW | ~1 | 51.51069° | 000.17588° |
| C | 14:35 | 95 ft | 5 °C | 5 °C | SW | ~1 | 51.50637° | 000.18191° |
| C | 87 ft | 5 °C | 5 °C | 51.50636° | 000.18189° | |||
| C | 90 ft | 6 °C | 5 °C | 51.50636° | 000.18188° | |||
| C average | 14:35 | 90.6 ft | 5.3 °C | 5.0 °C | SW | ~1 | 61.50636° | 000.18189° |
| B | 17:00 | 98 ft | 7 °C | 5 °C | SW | ~1 | 51.52550° | 000.14784° |
| B | 99 ft | 7 °C | 5 °C | 51.52537° | 000.14751° | |||
| B | 98 ft | 7 °C | 5 °C | 51.52538° | 000.14751° | |||
| B average | 17:00 | 98.3 ft | 7.0 °C | 5.0 °C | SW | ~1 | 51.52542° | 000.14762° |
| F | 17:25 | 91 ft | 6 °C | 5 °C | SW | ~1 | 51.52781° | 000.16091° |
| F | 110 ft | 6 °C | 5 °C | 51.52780° | 000.16091° | |||
| F | 98 ft | 6 °C | 5 °C | 51.52779° | 000.16092° | |||
| F average | 17:25 | 99.6 ft | 6.0 °C | 5.0 °C | SW | ~1 | 51.52780° | 000.16091° |
Appendix B: Visualization
Visualization No1.
(Some text here, explaining...)
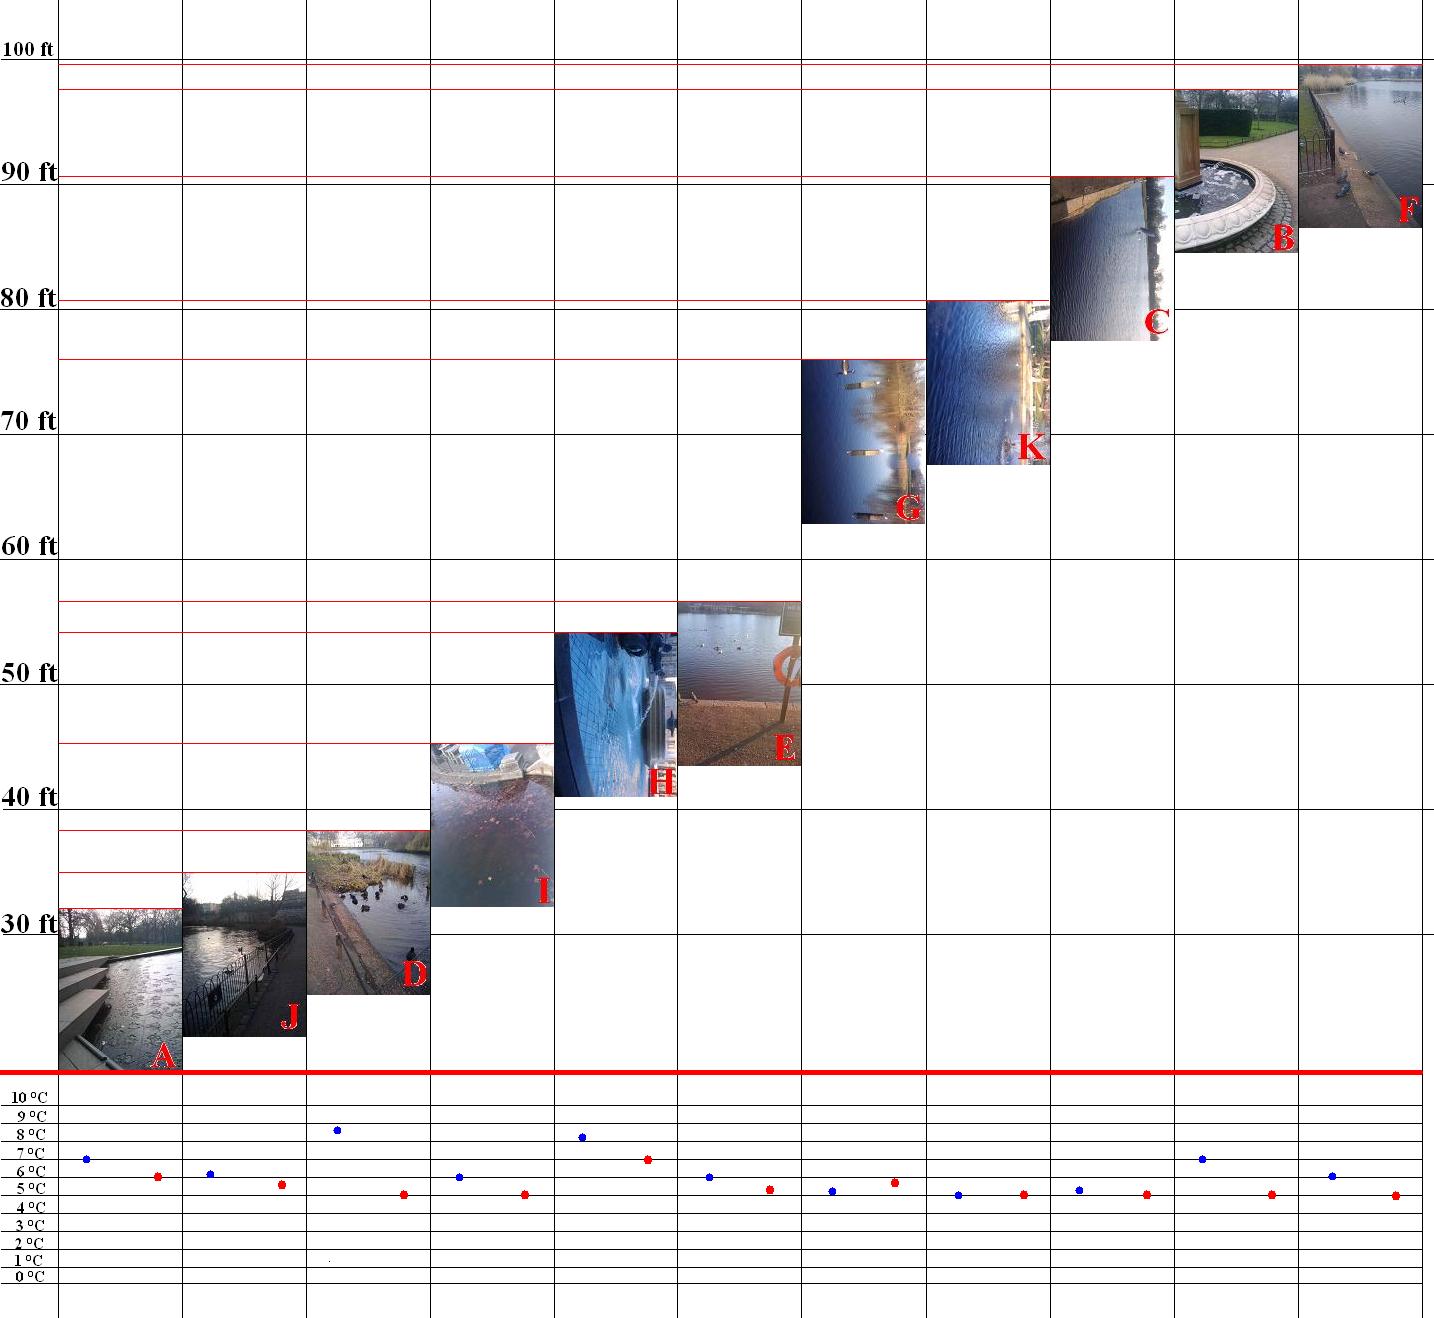
Visualization No2.
(Some text here, explaining...)
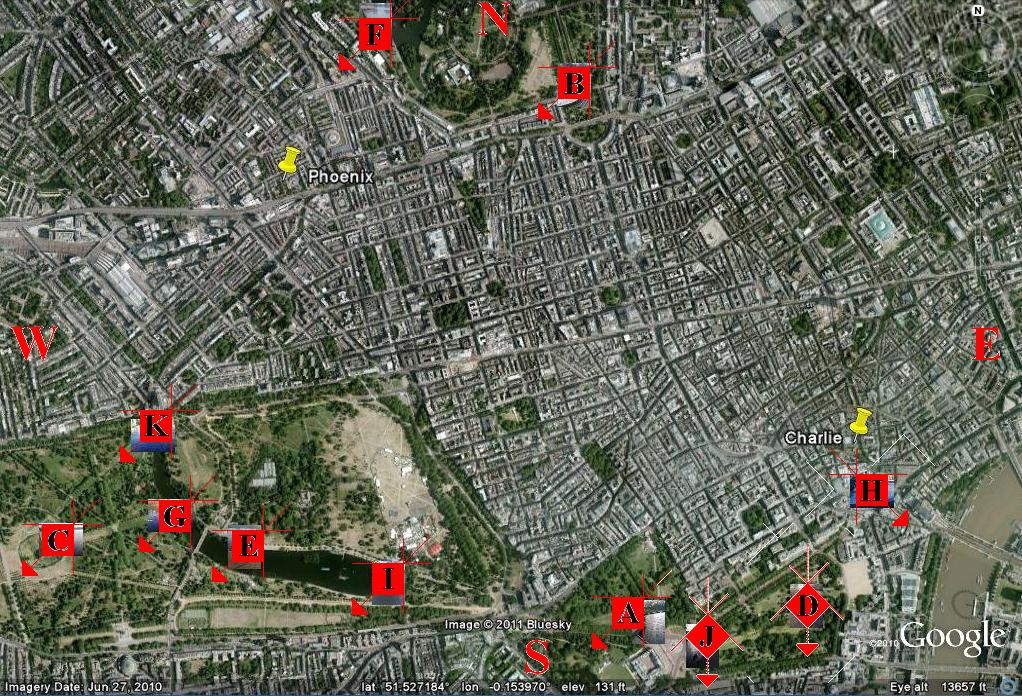
Appendix C: Who Did What
Eva Marengo My contribution to the lab was taking the water and air temperature readings and helping record the data. At each location I took three readings of the water and of the air. In the lab report I did the associated write up. I also assisted at navigation and finding the perspective of the photos taken in order to replicate them.
Vivian Bateyunga My contribution to the lab was collecting data on wind direction using a basic compass and a Tesco plastic bag. I also described what was North and South of the location of the water body. I assisted with copy-editing the lab write up and figuring out the averages for the raw data collected.
Sandra Mamus Ngeseyan I was the principle data-recorder for the group and also helped determine what the wind-speed at each location was. It was extremely important that my handwriting was neat and the recording of data was done in an organized fashion. I helped to write up the description of the lab, as well as gather information from different members of the group.
Ivan Babic I helped with geocoding and determining where are the places exactly and how to get there. I was collecting data of Latitude, Longitude and Elevation. Wiki editing and visualization of data.
England-2011-lab2-green
Green: Krystnell, Johanna, Spencer, McKayla, Gillian
Problem Description and Approach
For this lab, Dr. Obsfucation sent out eleven photographs of various bodies of water around central London. He informed us that Penelope Poison was threatening to release toxic substances at each location; he asked the Green Team to find each location using the photographs and take several readings at each location: longitude, latitude, elevation, wind direction, wind speed, water temperature, and air temperature. More importantly, for every reading it was necessary that we take three readings in order to make an accurate measurement.
Our initial approach dealt with using the geo-coding of each photograph to identify the longitude and latitude and then map out the locations. The photos were downloaded and imported into iPhoto, where the "Places" application created a map of the locations. With a time element involved, we decided to head towards Regents Park first, where two photographs were taken, and make our way back to Trafalgar Square, via Hyde Park and then Green Park / St. James Park. The methodology for the collection of necessary data is explained below.
Data Collection
In order to measure the latitude, longitude, and elevation of each site, we took three separate readings using a yellow Etrex GPS unit. At each location, we turned on the unit, waited for it to locate the satellites, and recorded the first set of readings. Then we moved the GPS unit away from the location and back to cause the GPS to take a new reading from the satellites. We recorded this second set of raw data and then moved the GPS a second time to for a final set of readings.
In order to determine wind direction, three group members took turns using a cigarette lighter at the location to determine the direction of the breeze, faced in that direction, and then took an angle reading using the compass. All three readings were recorded. In order to determine wind speed, different group members used the Beaufort scale to estimate a speed without consulting each other, and recorded their decision.
To determine water temperature, we pointed the Mini Infared Thermometer Fluke-62 at the body of water pictured in each photograph, recorded the temperature reading, and repeated this process two more times to come up with three readings. To determine the temperature of the air, we pointed the infared thermometer at the sky, pressed the button to take a reading, and repeated this two more times to produce three readings.
Data Analysis
| Location A | Location B | Location C | Location D | Location E | Location F | Location G | Location H | Location I | Location J | Location K | |
|---|---|---|---|---|---|---|---|---|---|---|---|
| Longitude | 51° 30.177' | 51° 31.522' | 51° 30.382' | 51° 30.209' | 51° 30.355' | 51° 31.699' | 51° 30.446' | 51° 30.492' | 51° 30.265' | 51° 30.107' | 51° 30.641' |
| Latitude | 0° 8.554' | 0° 8.852' | 0° 10.915' | 0° 7.917' | 0° 10.094' | 0° 9.652' | 0° 10.492' | 0° 7.651' | 0° 9.604' | 0° 8.326' | 0° 10.552' |
| Elevation | 3 m | 35 m | 22.6 m | (-)3.6 m | 14 m | 30 m | 13.6 m | 5.6 m | 14.6 m | 3 m | 16.3 m |
| Wind Direction | 258.3° | 203.3° | 243.3° | 323.3° | 165° | 238.3° | 250° | 48.3° | 286.6° | 32.6° | 223.3° |
| Wind Speed | 2 mph | 3.6 mph | 3 mph | 5.3 mph | 4 mph | 4.6 mph | 2 mph | 2.6 mph | 2.3 mph | 1.6 mph | 2 mph |
| Water Temperature | 43.16°F | 39.16°F | 39.16°F | 39.83°F | 39°F | 38.3°F | 39.83°F | 38.3°F | 39.6°F | 39.83°F | 38.83°F |
| Air Temperature | 32.3°F | 35.16°F | 33.16°F | 32.16°F | 32.6°F | 32.16°F | 34.5°F | 32.83°F | 33.6°F | 31.83°F | 34.6°F |
The air temperatures between our locations did not vary much they were all low temperatures with a range of 31°F-34°F. Due to this Penelope Poison cannot be harmful to the city of London because toxins are usually produced at warm temperatures. Also the water temperatures were mostly low in our locations except Green Park where the temperature was slightly higher than other places. This place has a higher risk of having toxins from Penelope Poison as compared to other locations we have been to. The wind speed in most of the areas that we went to was minimal therefore those areas have a low risk of getting toxins from Penelope Poison. St James Park had a higher wind speed as compared to the other areas we went to therefore the risk of having toxins from Penelope Poison are slightly higher in this place than other areas.
Error Analysis
GPS - The Etrex yellow GPS used to calculate the latitude and longitude of each location may be responsible for several significant sources of error during data collection. We noted that in locations such as Trafalgar square, where there were a number of tall buildings, signal reflection may have caused the information being sent to the receiver to be delayed contributing to further inaccuracy. Although the data obtained in very open locations such as parks were unlikely to be affected by a signal reflection, it is possible that interference with accurate data is attributable to a clock error within the GPS. If the clock inside the GPS was in fact not the same as the clocks of the satellites, this may have resulted in incorrect calculations. However, it was indicated by the system that all values obtained were within the range of +/- 3 metres. At 51 degrees latitude and thirty minutes, the length of one degree latitude is 111,258 metres. This means that the possible error is minimal ( +/- 0.000027 degrees). The length of a degree longitude is 69,440 and again the air is minimal ( +/- 0.000043 degrees).
Wind direction/Compass - We calculated the degree of human error in using the compass as well as a cigarette lighter to be +/- 5 degrees. It is possible that because three different persons were chosen to read the compass, the angle at which it was being held may not have been completely flat, and estimations may have been incorrect based on different strengths in vision. Also, in using a lighter to determine the general direction of the wind we noticed that at several times the direction of the wind changed. We attributed this to that fact that trees other obstructions may have caused the wind to shift its direction and noted it as a significant source of error.
Beaufort Scale - Our reliance on the Beaufort Scale to determine wind speed made our data collection especially sensitive to error. Although there was an intentional lack of discussion among the three group members chosen to use the scale at the different locations, there was a certain homogeneity of results as these members revealed their choices. Furthermore, no matter how basic the descriptions of the scale were, the data became relative to each individuals interpretation of these groupings
Mini Infrared thermometer (fluke-62) - A mini infrared thermometer (fluke-62) was used to calculate the air and water temperature at the various locations. Sources of error were expected to be minimal because of a consistency in measuring the temperature of same spot at each of these locations. It was discovered after data collection that our decision to point the thermometer to the sky to obtain a temperature may have contributed to incorrect readings. It would have been possible to reduce errors associated with this by aiming the thermometer a leaf at the different sites. Despite taking multiple readings and obtaining very similar numbers we note that the margin of error for the thermometer is +/- 4 degrees Celsius.
Images
Location A
Location B
Location C
Location D
Location E
Location F
Location G
Location H
Location I
Location J
Location K
Appendix A: Raw Data
Note: The last reading is the average of all three readings.
Location A
Lat – 51° 30.178’ ; 51° 30.177’ ; 51° 30.177’ ---- 51° 30.177'
Long – 0° 8.553’ ; 0° 8.556’ ; 0° 8.554’ ---- 0° 8.554'
Elv – 2 m ; 3 m ; 4 m ---- 3 m
Wind Direction – 260° ; 255° ; 260° ---- 258.3°
Wind speed – 1 (1 mph) ; 1 (2 mph) ; 1 (3 mph)---- 2 mph
Water Temp – 43°F ; 43°F ; 43.5°F ---- 43.16°F
Air Temp – 32°F ; 32.5°F ; 32.5°F ---- 32.3°F
Location B
Lat – 51° 31.521’ ; 51° 31.522’ ; 51° 31.523’ ---- 51° 31.522'
Long – 0° 8.852’ ; 0° 8.851’ ; 0° 8.852’ ---- 0° 8.852'
Elv – 36 m ; 34m ; 35 m ---- 35 m
Wind Direction – 210° ; 200° ; 200° ---- 203.3°
Wind speed – 2 (5 mph) ; 2 (4 mph) ; 1 (2 mph)---- 3.6 mph
Water Temp – 40°F ; 39°F ; 38.5°F ---- 39.16°F
Air Temp – 38°F ; 35°F ; 32.5°F ---- 35.16°F
Location C
Lat – 51° 30.383’ ; 51° 30.382’ ; 51° 30.382’ ---- 51° 30.382'
Long – 0° 10.914’ ; 0° 10.915’ ; 0° 10.915’ ---- 0° 10.915'
Elv – 22 m ; 22 m ; 24 m ---- 22.6 m
Wind Direction – 240° ; 245° ; 245° ---- 243.3°
Wind speed – 1 (2mph) ; 1 (3 mph) ; 2 (4 mph) ---- 3 mph
Water Temp – 39°F ; 39°F ; 38.5°F ---- 39.16°F
Air Temp – 33°F ; 33°F ; 33.5°F ---- 33.16°F
Location D
Lat – 51° 30.208’ ; 51° 30.208’ ; 51° 30.210’ ---- 51° 30.209'
Long – 0° 7.915’ ; 0° 7.918’ ; 0° 7.917’ ---- 0° 7.917'
Elv – (-)6 m ; (-)3 m ; (-)2 m ---- (-)3.6 m
Wind Direction – 320° ; 330° ; 320° ---- 323.3°
Wind speed – 2 (6 mph) ; 2 (5 mph) ; 2 (5 mph) ---- 5.3 mph
Water Temp – 40°F ; 40°F ; 39.5°F ---- 39.83°F
Air Temp – 32.5°F ; 32°F ; 32°F ---- 32.16°F
Location E
Lat – 51° 30.354’ ; 51° 30.356’ ; 51° 30.354’ ---- 51° 30.355'
Long – 0° 10.091’ ; 0° 10.091’ ; 0° 10.101’ ---- 0° 10.094'
Elv – 13 m ; 16 m ; 13 m ---- 14 m
Wind Direction – 160° ; 170° ; 165° ---- 165°
Wind speed – 2 (4 mph) ; 1 (3 mph) ; 2 (5 mph) ---- 4 mph
Water Temp – 40°F ; 38.5°F ; 38.5°F ---- 39°F
Air Temp – 32.5°F ; 32.5°F ; 33°F ---- 32.6°F
Location F
Lat – 51° 31.669’ ; 51° 31.669’ ; 51° 31.668’ ---- 51° 31.699'
Long – 0° 9.652’ ; 0° 9.652’ ; 0° 9.651’ ---- 0° 9.652'
Elv – 31 m ; 31 m ; 28 m ---- 30 m
Wind Direction – 240° ; 245° ; 230° ---- 238.3°
Wind speed – 2 (5 mph) ; 2 (4 mph) ; 2 (5 mph) ---- 4.6 mph
Water Temp – 38.5°F ; 38.5°F ; 38°F ---- 38.3°F
Air Temp – 32°F ; 32°F ; 32.5°F ---- 32.16°F
Location G
Lat – 51° 30.446’ ; 51° 30.445’ ; 51° 30.446’ ---- 51° 30.446'
Long – 0° 10.492’ ; 0° 10.492’ ; 0° 10.491’ ---- 0° 10.492'
Elv – 13 m ; 14 m ; 14 m ---- 13.6 m
Wind Direction – 260° ; 240° ; 250° ---- 250°
Wind speed – 1 (2 mph) ; 1 (2 mph) ; 1 (2 mph) ---- 2 mph
Water Temp – 39.5°F ; 40°F ; 40°F ---- 39.83°F
Air Temp – 34.5°F ; 34.5°F ; 34.5°F ---- 34.5°F
Location H
Lat – 51° 30.492’ ; 51° 30.492’ ; 51° 30.491’ ---- 51° 30.492'
Long – 0° 7.650’ ; 0° 7.651’ ; 0° 7.651’ ---- 0° 7.651'
Elv – 6 m ; 5 m ; 6 m ---- 5.6 m
Wind Direction – 40° ; 50° ; 55° ---- 48.3°
Wind speed – 1 (3mph) ; 1 (3 mph) ; 1 (2mph) ---- 2.6 mph
Water Temp – 38.5°F ; 38°F ; 38.5°F ---- 38.3°F
Air Temp – 33°F ; 32.5°F ; 33°F ---- 32.83°F
Location I
Lat – 51° 30.265’ ; 51° 30.264’ ; 51° 30.265’ ---- 51° 30.265'
Long – 0° 9.604’ ; 0° 9.604’ ; 0° 9.604’ ---- 0° 9.604'
Elv – 13 m ; 16 m ; 15 m ---- 14.6 m
Wind Direction – 300° ; 280° ; 280° ---- 286.6°
Wind speed – 1 (3 mph) ; 1 (2 mph) ; 1 (2 mph) ---- 2.3 mph
Water Temp – 39.5°F ; 39.5°F ; 40°F ---- 39.6°F
Air Temp – 33.5°F ; 33.5°F ; 34°F ---- 33.6°F
Location J
Lat – 51° 30.108’ ; 51° 30.106’ ; 51° 30.106’ ---- 51° 30.107'
Long – 0° 8.326’ ; 0° 8.326’ ; 0° 8.325’ ---- 0° 8.326'
Elv – 2 m ; 3 m ; 4 m ---- 3 m
Wind Direction – 30° ; 33° ; 35° ---- 32.6°
Wind speed – 1 (2 mph) ; 1 (1 mph) ; 1 (2 mph) ---- 1.6 mph
Water Temp – 40°F ; 40°F ; 39.5°F ---- 39.83°F
Air Temp – 31.5°F ; 32°F ; 32°F ---- 31.83°F
Location K
Lat – 51° 30.643’ ; 51° 30.639’ ; 51° 30.641’ ---- 51° 30.641'
Long – 0° 10.551’ ; 0° 10.551’ ; 0° 10.554’ ---- 0° 10.552'
Elv – 17 m ; 15 m ; 17 m ---- 16.3 m
Wind Direction – 220° ; 220° ; 230° ---- 223.3°
Wind speed – 1 (2 mph) ; 1 (3 mph) ; 1 (1 mph) ---- 2 mph
Water Temp – 39°F ; 38.5°F ; 39°F ---- 38.83°F
Air Temp – 34.5°F ; 35°F ; 34.5°F ---- 34.6°F
Appendix B: Visualization
VISUALIZATION WORK
RANGES:
Elevation (-) 3.6m (to) 35m
Wind Direction 32.6 (to) 323.3
Wind Speed 1.6 (to) 5.3
Water Temperature 38.3 (to) 43.16
Air Temperature 31.83 (to) 35.16
Locations from Low Elevation to High Elevation
1) D - (-) 3.6m
2) J - 3m
3) A - 3m
4) H - 5.6m
5) G - 13.6m
6) E - 14m
7) I - 14.6m
8) K - 16.3 m
9) C - 22.6m
10) F - 30m
11) B - 35m
Wind Direction Values in order of location numbers (in degrees):
323.3, 32.6, 258.3, 48.3, 250, 165, 286.6, 223.3, 243.3, 238.3, 203.3
Wind Speed Values in order of location numbers (in miles per hour):
5.3, 1.6, 2, 2.6, 2, 4, 2.3, 2, 3, 4.6, 3.6
Water Temperature Values in order of location numbers (in degrees Fahrenheit):
39.83, 39.83, 43.16, 38.3, 39.83, 39, 39.6, 38.83, 38.83, 38.3, 39.16
Air Temperature Values in order of location numbers (in degrees Fahrenheit) :
32.16, 31.83, 32.3, 32.83, 34.5, 32.6, 33.6, 34.6, 33.16, 32.16, 35.16
Appendix C: Who Did What
Spencer ~ During the lab I was responsible for recording the data as well as providing one of the three readings for both wind direction and wind speed. Because I downloaded the pictures onto my computer before the lab, and was able to identify the geo-coding with iPhoto, I wrote the "Problem Description and Approach". After McKayla calculated the measurements and entered the raw data onto the wiki, I edited it with the proper notations. I also created the table with all of our measurements and made sure the photographs and visualizations were properly embedded.
Johanna ~ During the lab I used the GPS unit to take readings for latitude, longitude, and elevation, as well as helping determine wind direction with the lighter. I wrote the data collection section of the lab write-up.
McKayla ~ During the lab I took readings for air and water temperatures at each locations. I also was responsible for taking the Green Team's photographs at each location. I created the visualizations for the data on the lab write-up.
Krystnell ~ During the lab I was one of the three members responsible for giving a reading for both wind direction and wind speed. In the lab write-up I took care of the sections concerning the sources of error.
Gillian ~ During the lab I also took the readings of the wind direction and wind speed along with two other people. I also did the second part of the data analysis section.
