Archive:England
2025 Note: Most of the original content from these pages is from 2011. It is being condensed here for record keeping.
Contents
- 1 2011 Earlham College England Program
- 1.1 London Resources
- 1.2 Calendar
- 1.3 Excursions
- 1.3.1 Cambridge Excursion, Saturday 15 January 2011
- 1.3.2 Ice Skating at Somerset House, Saturday 22 January 2011
- 1.3.3 Greenwich Excursion, Saturday 29 January 2011
- 1.3.4 Science Museum I, Tuesday 1 February 2011
- 1.3.5 Parliament Tour (Tuesday 8 February)
- 1.3.6 Whose Science? at the Dana Centre (Wednesday 09 February, 19:00 - 20:30) - optional, requires RSVP
- 1.3.7 Greenland at the National Theatre, Friday 11 February 2011
- 1.3.8 Kew Gardens, Saturday 12 February 2011
- 1.3.9 Designer Life, Cooler World at the Dana Centre (Wednesday 16 February, 19:00 - 20:30) - optional, requires RSVP
- 1.3.10 Lab 2: Holy Pigeon P#$! Batman, it's Penelope Poison! (Sunday 20 February, 11:00 - 19:00, with dinner at the flat)
- 1.3.11 IQ2: Free Data at the Dana Centre (Tuesday 22 February, 19:00 - 20:30) - optional, requires RSVP
- 1.3.12 Earth System Modeling at the National Theatre (Wednesday 23 February, 18:00 - 19:00) - optional, requires a ticket that the program will purchase if you are interested in attending
- 1.3.13 Spring Break Travel Plans
- 1.3.14 A Mole in London: Tunnelling Beneath the City, lecture at the Royal Geological Society (Wednesday 16 March, 17:30 - 20:00) - optional, requires RSVP
- 1.3.15 Clybourne Park, Wednesday 16 March 2011
- 1.3.16 Education Program at the Globe Theatre (Monday 4 April, 14:00 - 15:30)
- 1.3.17 Bath Excursion, Friday-Sunday 1-3 April, 2011
- 1.3.18 The Anthropocene: Living in a New Age, lecture at the Royal Geological Society (Wednesday 20 April, 17:30 - 20:00) - optional, requires RSVP
- 1.3.19 Hamlet at the Globe Theatre, Saturday 23 April 2011
- 1.4 Science, Technology and Society
- 1.5 Mashups
- 2 Science, Technology and Society - Syllabus
- 3 Assignments
- 3.1 Due Friday 25 February
- 3.2 Due Sunday 20 February
- 3.3 Due Saturday 19 February
- 3.4 Due Friday 18 February
- 3.5 Due Thursday 17 February
- 3.6 Due Tuesday 15 February
- 3.7 Due Monday 14 February
- 3.8 Due Friday 11 February
- 3.9 Due Tuesday 8 February
- 3.10 Due Monday 7 February
- 3.11 Due Saturday 5 February
- 3.12 Due Tuesday 1 February
- 3.13 Due Monday 31 January
- 3.14 Saturday 29 January
- 3.15 Due Friday 28 January
- 3.16 Due Tuesday 25 January
- 3.17 Due Monday 24 January
- 3.18 Due Tuesday 17 January
- 3.19 Due Monday 16 January
- 3.20 Due Tuesday 11 January
- 3.21 Due Monday 10 January
- 4 Lab 1: Where Am I?
- 5 Lab 2: Holy Pigeon P#$@ Batman, it's Penelope Poison!
- 6 Lab Notebooks
- 6.1 Lab 1: Where Am I?
- 6.2 Lab 2: Holy Pigeon P#$! Batman, it's Penelope Poison!
- 7 Journals
2011 Earlham College England Program
This is the wiki for the program. Program related materials and the bulk of the Earlham course materials (Science, Technology and Society) are located here. Other on-line resources for the program are:
- FIE's Moodle entry for the course (So far we're only using this for attendance.)
- Program blog (Posts by Charlie and eventually Fitz and the students too.)
Who we are: Eva Marengo Sanchez, Sandra Ngeseyan, Ben Smith, Krystnell Storr, Spencer Smith, Emily Van Cise, Johanna Wilcox, Ivan Babic, Gillian Bateyunga, Lily Cutler, Bill Greene, McKayla Heller, Vivian Bateyunga, Andrew Fitz Gibbon (program assistant), Charlie Peck (program leader)
London Resources
- Weekend Tube Closures
- Transport for London Journey Planner
- FIE's London center website
- Time Out's event listing for London
Calendar
- Embedded Google calendar goes here, for now: Google Calendar
Excursions
Cambridge Excursion, Saturday 15 January 2011
Travel
You will need to be at King's Cross station at the Information booth by the big trainboard by 08:45 at the latest. The train leaves at 09:15 from King's Cross, arriving at Cambridge at 10:02. We'll return on the 20:15 from Cambridge, arriving back at King's Cross station at 21:04. You will need to be at the Cambridge station by 20:30 at the latest.
Preparation
- Before Saturday morning you should read/skim the Wikipedia page about Cambridge (see below) to learn about the history of Cambridge and a bit about what's there.
- Look through the list of museums (see below) and think about which ones you might want to visit.
Plan
When we get to Cambridge we'll split-up into groups based on which museums/sites/etc we plan on visiting. Lunch will be on your own and then we'll meet for dinner around 17:30. That should give us enough time to eat and make it back to the train station for our 20:15 ride back to London.
Bloggers
We will need two volunteers from the studio audience to take pictures and write-up/post a blog entry about this excursion. Get in touch if you are interested.
Science, Technology and Society
There are many connections to the course in Cambridge, here is a sampling of them:
- Francis Bacon - scientific method
- Issac Newton - calculus, gravity
- Cavendish Laboratory - hydrogen, density of the earth
- Charles Darwin - evolution through natural selection
- Alan Turing - basic model of computation
- Francis Crick and James Watson - structure of DNA
Since it's so early in the semester we haven't read or discussed any of these yet. Given that I'd like you to spend a minimum of 2 hours in any one of the science museums looking around and learning about what it has to offer. See the list under "Museums" for places that qualify for this. To document this you should be prepared to talk a bit about what you saw and learned when we meet for dinner.
To add a shameless self plug: The Wellcome Trust Sanger Institute and the European Bioinformatics Institute are about 15 minutes south of the town. Both organizations are doing work to apply computers to biological and chemical problems. --Spwein06 13:46, 13 January 2011 (UTC)
About Cambridge
Cambridge is a relatively small (~100K people), picturesque university town about 50 miles Northeast of London. It is distinguished by the many universities and colleges located there and their museums, architecture, people, etc. There are also a couple of very nice markets in-town.
- Cambridge (Wikipedia)
- Cambridge University (Wikipedia)
Museums
- Museums in Cambridge (Wikipedia)
- New Hall Art Collection - all women artists
- Scott Polar Museum/Research Institute (S, T and S)
- Sedgwick Museum of Earth Sciences (S, T and S)
- University Museum of Zoology (S, T and S)
- University Fitzwilliam Museum - art and antiquities
- The Cambridge Museum of Technology - eh
Unfortunately the Whipple Museum of Science History and the Museum of Archeology and Anthropology are both closed for renovations now.
Markets
There is general market in the town square and an art and craft market in All Saints Garden, both on Saturdays.
- Market information (Cambridge City Council)
Ice Skating at Somerset House, Saturday 22 January 2011
Dinner
We'll have dinner at the flat before heading to Somerset House to go skating, since we need to be at Somerset House by 18:00 let's plan on meeting at the flat for dinner at 16:00. That should give us plenty of time to eat, get organized, and then get to Somerset House. It's only a few blocks from the flat to the rink so I think we can walk/roll there pretty easily.
Skating
If you haven't been ice skating before don't worry, many of us have and you'll be able to get plenty of support and advice (possibly more than you want). Either way I would suggest reading Somerset's skating FAQ, found here.
More information about Somerset House and their collections of paintings, photography, video, etc. can be found here
Greenwich Excursion, Saturday 29 January 2011
Travel
Outbound:
- We all need to be at the Embankment Pier (map), just across from the Embankment Underground station, by 9:15 Saturday morning. I'll have the ferry tickets with me.
- The ferry will leave Embankment Pier at 9:38 for Greenwich.
- The trip takes less than an hour, the view is much nicer from the (exposed to the elements) upper-deck of the boat, consider dressing appropriately for that environment.
Return:
- We all need to be at the Greenwich Cutty Sark DLR station (map) by 17:00 Saturday afternoon.
- We'll take the DLR and then the Underground back to the West End for dinner at the flat.
Thames Clipper, http://www.thamesclippers.com/
Preparation
Make sure that at least one person in each lab group brings a laptop with them to Greenwich (see the Labs page for the lab groups).
Read about the three principle science pieces we'll work on in Greenwich, these are listed under Greenwich on the Supplemental Material page.
Read about the town of Greenwich and the things we'll see there:
- About Greenwich (Wikipedia)
- Royal Observatory (Wikipedia)
- National Maritime Museum
- Greenwich Market - this is a very old market, chartered in 1700
- Old Royal Naval College
- Greenwich Park
Other sites in and around Greenwich:
- Cutty Sark - an old famous boat
- Gipsy Moth IV - a relatively new famous boat, piloted on an around the world journey
- Greenwich foot tunnel - an old bit of solid engineering that takes you under the Thames
Plan
- I'll distribute printouts of the lab after we board the ferry for the trip to Greenwich so we can review those on the way. I'll also give you money for lunch (unless we decide to eat en masse).
- After arriving at the pier in Greenwich we'll walk up to the Royal Observatory and tour the grounds and museum together. There are a number of things to observe and discuss as a group there.
- When we are done at the Royal Observatory you folks will start working on the lab in groups. I expect that it will take you an hour or two to do the data collection component, which is the only part that needs to be done while we're in Greenwich. I'll be available to answer questions, etc. during this time.
- Once you are done with the lab work you are free to explore any of the other sites in Greenwich (see above).
- We'll meet at the Greenwich DLR station by 17:00 for tube ride back to the West End and ultimately to the flat for chili, etc.
Bloggers
We will need two volunteers from the studio audience to take pictures and write-up/post a blog entry about this excursion. Get in touch if you are interested.
Science, Technology and Society
There are many connections to the course in Greenwich, among the principle ones:
- Royal Observatory (Wikipedia)
- John Harrison's marine chronometers
- Longitude 0, aka the Prime Meridian
- Many of the exhibits in the National Maritime Museum
Your principle course related tasks while we're in Greenwich will be at the Royal Observatory and working on data collection for the lab.
First Lab
- See Lab Descriptions.
Science Museum I, Tuesday 1 February 2011
This is the first of at least three excursions we'll take to the Science Museum, this one is focused on climate and related topics.
Travel
For those of you that haven't already been there (I've been 4 times since arriving in December, and then again last week to plan this trip...) it is located on Exhibition Road, a couple of blocks from FIE.
Preparation
See the assignments page.
Plan
Atmosphere
Can algae save the world?
Blogger and Photographer
We will need two volunteers from the studio audience to take pictures and write-up/post a blog entry about this excursion. Get in touch if you are interested.
Science, Technology and Society
What do to in the Atmosphere exhibit?
What do to with the algae exhibit?
Homework
See the assignments page.
Parliament Tour (Tuesday 8 February)
Whose Science? at the Dana Centre (Wednesday 09 February, 19:00 - 20:30) - optional, requires RSVP
Greenland at the National Theatre, Friday 11 February 2011
Travel
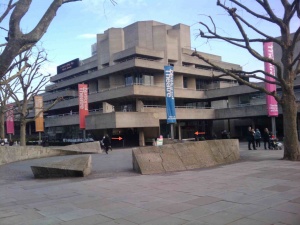
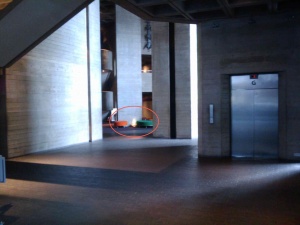
We'll meet at the National Theatre at 18:00 on Friday, just outside the doors on the North side of the building near the South bank of the Thames. I'm planning on bringing dinner (bread, cheese, fruit, salami, etc.) for us to eat in the public area inside the theatre on the first floor (just inside either of the doors marked below).
The two closet Tube stations are Embankment and Waterloo. If you use Embankment you will need to take the footbridge across the Thames that's located just outside the Tube station, head to the East as you exit the footbridge. If you go to Waterloo you will need to circle around to the North side of the National to find the entrance doors.
If you get there early there is plenty to do in the immediate vicinity, a nice skate park, used book vendors, park benches with a nice view of the Thames, etc.
Preparation
1. Read a bit about the play Greenland. The National Theatre's website has background information about it and the playwrights who wrote it. The play was commissioned by the National and follows in a long line of works dating back to the early 1980s that seek to address the big questions/problems facing society as a result of technology and the changes it brings.
2. Listen to the This American Life segment called Climate Changes, People Don't. The details are on the assignments page.
Plan
After the play there will be opportunity for us to participate in a discussion about the play:
After each performance of Greenland , there will be the chance to discuss and debate the complex issues raised in the play by sitting at the ‘Talkaoke’ table. Talkaoke, presented by ‘The People Speak’, is a unique interactive discussion format for sharing views, engaging with a variety of different perspectives and debating with other members of the audience.
More information is available at http://talkaoke.com
Blogger and Photographer
We will need two volunteers from the studio audience to take pictures and write-up/post a blog entry about this excursion. Get in touch if you are interested.
Science, Technology and Society
See the assignments page for the This American Life segment to listen to beforehand and a description of the write-up that's due afterwords.
Kew Gardens, Saturday 12 February 2011
Travel
We'll meet outside the Kew Gardens tube station (District line) at 10:00 on Saturday. It's a short walk from there to the Victoria Gate entrance. Don't forget to check the TFL's weekend closures list ahead of time to make sure you know the route to take on Saturday morning.
For the return trip to London we'll meet outside the Kew Gardens tube station at 17:00.
Preparation
- Read about Kew Gardens and the Royal Botanic Gardens, there is a wealth of information on their website and in the Wikipedia article about Kew. In particular make sure you read about the science that is done at Kew:
- Check the assignments page to see what's due related to this excursion, considering those ahead of time will make your visit much more informative.
- Brent Smith, one of the Biologists at Earlham and someone who is very knowledgeable about Kew, suggests the following:
- Cedars of Lebanon
- Victoria waterlily from Argentina
- All of the greenhouses
Plan
Once we're there and have secured tickets, etc. you are on your own to explore during the morning.
For lunch we'll meet at 13:00 at one of the Kew's cafes (TBD when we get there, probably the Orangery self-service menu) to discuss what we're seeing and learning.
After lunch we'll take a tour together on the Kew Explorer around the grounds. Afterwords you are again free to explore on your own.
We'll meet outside the Kew Gardens tube station at 17:00 for the return trip to London.
Science, Technology and Society
There is a lot of science and some interesting technology as well at Kew. Read the information found at the URLs listed above beforehand so you are prepared to engage it while we are there.
There are two homework items related to our visit to Kew Gardens, the details for both of them can be found on the assignments page.
Blogger and Photographer
We will need two volunteers from the studio audience to take pictures and write-up/post a blog entry about this excursion. Get in touch if you are interested. In order to spur interest in these positions I'm offering 5 bonus points if you take on one of these tasks.
- Mamus is offering to write a blog post about this excursion : )
Designer Life, Cooler World at the Dana Centre (Wednesday 16 February, 19:00 - 20:30) - optional, requires RSVP
Lab 2: Holy Pigeon P#$! Batman, it's Penelope Poison! (Sunday 20 February, 11:00 - 19:00, with dinner at the flat)
IQ2: Free Data at the Dana Centre (Tuesday 22 February, 19:00 - 20:30) - optional, requires RSVP
Earth System Modeling at the National Theatre (Wednesday 23 February, 18:00 - 19:00) - optional, requires a ticket that the program will purchase if you are interested in attending
Spring Break Travel Plans
- Eva
- Sandra - Cornwall
- Ben - Prague and Sussex (Lewes)
- Krystnell - Spain (Barcelona, Palma Mallorca, Madrid)
- Spencer - Spain (Barcelona, Palma Mallorca, Madrid)
- Emily - Finland (Tampere)
- Johanna - Spain (Malaga, Nerja)
- Ivan - Edinburgh
- Gillian - Wales (Cardiff, Swansea, etc.)
- Vivian - Wales (Cardiff, Swansea, etc.)
- Lily - Dublin
- Bill - Copenhagen and Amsterdam
- McKayla - Amsterdam, Bruges and Spain (Valencia)
- Fitz
- Charlie - Buckinghamshire
A Mole in London: Tunnelling Beneath the City, lecture at the Royal Geological Society (Wednesday 16 March, 17:30 - 20:00) - optional, requires RSVP
Clybourne Park, Wednesday 16 March 2011
Dinner
- At the flat beforehand?
- Menu? Chicago meal?
The Play
- www.clybournepark.co.uk
- Wednesday evening at 19:30 at Wyndham's Theatre (around the corner from Charlie and Fitz's flat), at the theatre no later than 19:15.
- Background
- Reviews
Education Program at the Globe Theatre (Monday 4 April, 14:00 - 15:30)
Bath Excursion, Friday-Sunday 1-3 April, 2011
Preparation
- Before Friday afternoon you should read/skim the Wikipedia page about Bath (see below) to learn about the history of Bath and what's there.
- Again before we leave look through the list of museums, sites, etc. (see below) and think about which ones you might want to visit.
Travel
Bath is located about 100 miles west of London, we'll be taking the train for this excursion. Leave Friday evening about 18:00 and returning around 12:00 on Sunday.
Lodging
Probably St Christopher's hostel.
Plan
When we get to Cambridge we'll split-up into groups based on which museums/sites/etc we plan on visiting. Lunch will be on your own and then we'll meet for dinner around 17:30. That should give us enough time to eat and make it back to the train station for our 20:15 ride back to London.
Bloggers
We will need two volunteers from the studio audience to take pictures and write-up/post a blog entry about this excursion. Get in touch if you are interested.
Science, Technology and Society
Probably the biggest, literally, thing related to science in or near Bath is Stonehenge (Wikipedia), the monument built some 4500 years ago to track celestial movements, by people that had no written language that we know of. There are tours which take approximately three hours leaving from central Bath on Saturday. This includes a tour through the local countryside (very bucolic) and drive-bys of other sites related to the people who made and used Stonehenge.
If anyone is interested in going on a tour (the cost of which would be covered by the program) then get in touch with Charlie RSN.
About Bath
Bath is a very old city, the charter was granted in 1590 and history of the city goes back to the time of the Romans (~AD 43) when it was established as a spa resort. There are many sites in and around Bath related to this history.
Remember that your cultural allowances are good in Bath too, just save your receipts and turn them in to Charlie to be reimbursed after the trip. If you want to keep the stub just photocopy it first and turn-in the photocopy for reimbursement.
- Bath's Wikipedia entry
- Places of interest in Bath (Wikipedia)
Museums
- Jane Austen Centre
Sites
- The Roman Baths (Wikipedia) - this is a must see
- Royal Crescent
- The Circus
- Kennet and Avon Canal
- Pulteney Bridge
- Bath Cider Festival? (Food, cider, music, etc. 11:00-16:00 Saturday)
Market
The Anthropocene: Living in a New Age, lecture at the Royal Geological Society (Wednesday 20 April, 17:30 - 20:00) - optional, requires RSVP
Hamlet at the Globe Theatre, Saturday 23 April 2011
Travel
Preparation
Some of you may have covered this ground in other classes, if so just fill-in the blanks.
- Read about the Globe Theatre, then and now
- Read about Hamlet
- See Shakespeare in Love (at the flat with popcorn, etc.)
Plan
Theatre tour?
Exhibition?
One half of the tickets are "groundlings", the other half in a box. I propose that we offer people the chance to switch during intermissions.
Traditional English dinner afterwords?
Blogger and Photographer
We will need two volunteers from the studio audience to take pictures and write-up/post a blog entry about this excursion. Get in touch if you are interested.
Science, Technology and Society
Homework
See the assignments page.
Science, Technology and Society
Class
Labs
Other
- Milestones, Techniques and Themes
- Syllabus
- Class Feedback Survey (SurveyMonkey)
Tech Tips
Working with Wikis
A wiki, like Wikipedia, is just a tool for making it easy to create and update web documents. In exchange for relatively "plain" web pages we have the ability for anyone anywhere to easily publish and update content with just a web browser.
To edit a page, click the Edit link that appears on each page. This is in the form of a tab at the top of the page. A form will appear, containing the existing prose and markup commands. When you have finished making modifications, click the Save button.
If all you do to start is type your prose in paragraph form with blank lines between the paragraphs the content will look fine. You can "grow into" the wiki markup language slowly as you need to.
Resources:
- Formatting commands for MediaWiki (the flavor of wiki we use)
- The MediaWiki FAQ
Embedding Images
You can embed many different types of images in a wiki page although the format dictates how much flexibility/features you have. In general you will want to convert images to JPG or PNG if you want to take advantage of thumbnails, re-sizing, etc.
- This is an example of a an embedded JPG image with a thumbnail and caption:
The canonical reference for embedding images in MediaWiki syntax is here.
Random Items
This is a collection of (possibly somewhat) related things, places, people, concepts, etc. that came-up during class or an excursion.
Camera Obscura - Possibly used by Vermeer.
- BBC article
- Camera Obscura description (Wikipedia)
Drake's Equation - For estimating the number of detectable extraterrestrial civilizations in the Milky Way galaxy.
- Drake's Equation (Wikipedia)
Museum Funding - in America, with visitor statistics.
- The American Association of Museums FAQ
Fibonacci Sequence - 0, 1, 1, 2, 3, 5, 8, 13, ...
- Fibonacci sequence (Wikipedia).
- There is a very nice bit done by the BBC on the Fibonacci sequence here.
Mashups
- Where we live and work.
- Where we have visited.
Science, Technology and Society - Syllabus
- CS-282, England Program, Spring 2011
- Charlie Peck, charliep at cs dot earlham dot edu
- Andrew Fitz Gibbon (teaching assistant), fitz at cs dot earlham dot edu
Overview
There is a long history of advances in science and technology shaping the development of human societies. The pace of change driven by technological and scientific advances continues to increase, to the point where those advances are now the defining feature of modern life. This course will examine some of the major milestones of science and discovery and their effects on human societies.
We'll consider the principle discoveries and developments in a wide range of natural science and allied disciplines over the past 300 years or so. As part of this we'll examine the changes those developments and discoveries engendered in society. With this historical context we'll then consider what scientific and technological developments the (relatively near) future may bring and what their effects on human society might be. We'll also look at how society drives science and scientific discovery through Citizen Science projects.
England was the location of many of the important scientific advances we'll examine, London is also one of the places with a concentration of people that think and write about the future of science, technology and society.
The bulk of the work for this course will be reading, discussion, labs, and writing assignments. There will be some lectures but not large quantities of them. This is a four credit course, we'll meet twice a week for 2 hours each plus about four field trips. Some of the other trips we'll take during the program will include small components of material related to this class as well. Science and technology are all around us, we'll leverage that during this class.
This course fulfills the non--lab Scientific Inquiry and Quantitative Reasoning general education requirements.
Materials
There are two texts for this course:
- Robert Hazen and James Trefil, Science Matters , Anchor; Reprint edition (June 2, 2009), ISBN-13: 978-0307454584
- Rudi Volti, Society and Technological Change , Worth Publishers; Sixth Edition edition (March 6, 2009), ISBN-13: 978-1429221214
I expect that you will have acquired these books before arriving in London in January. Both are readily available from e.g. Amazon. Be sure you have the correct editions of both texts.
We'll also read articles or chapters written by some of the following people:
- Alvin Toffler
- Richard Dawkins
- Rachel Carson
- Bill Bryson
- Malcolm Gladwell
- Ray Kurzweil
- Howard Rheingold
I will provide you with copies of these at the appropriate times.
Field Trips
As part of this course we'll visit a number of places related to the history of science and technology in England. Darwin's home, the site of the first mashup, and the Royal Observatory in Greenwich among them. These trips will be done in the context of our readings and labs, e.g. when we visit Greenwich we'll work on a lab that incorporates the measurement of time and distance, building on Harrison's work to develop a method for determining longitude.
Assignments
There will be four types of assignments for this class: readings, exercises, labs, and writing.
Readings
We'll have regular reading assignments from the texts and from the other sources listed above. We'll discuss those readings as part of our class meetings and during our field trips.
Henry Petroski
- Henry Petroski on science and technology, from the December, 2010 issue of IEEE/Spectrum.
Greenwich
- Wikipedia's Time entry - Read the Introduction, section 1 (Temporal measurement) and section 2 (Definitions and standards)
- Wikipedia's Latitude entry - Read the Introduction, section 1 (Examples), section 2 (Subdivisions) and section 3 (Effect of latitude).
- Wikipedia's Longitude entry - Read the Introduction, section 1 (History), section 2 (Noting and calculating longitude) and section 3 (Plate movement and longitude).
Exercises
Periodically we will work on exercises related to the readings, most of these will require you to learn about particular scientific or technological concepts and demonstrate a basic understanding of them.
Labs
In order to learn how science is practiced and the strengths and weaknesses of the scientific method this course will incorporate a number of labs. Given that we'll have somewhat limited facilities and equipment these will typically involve using fairly basic tools, but as you will see it is possible to do a significant amount of science without sophisticated laboratories and instruments.
Journals
Each week I'll ask a question or two about the material we're covering and ask you to respond in an on--line journal. I'll provide you with a web--based mechanism for these journals so that it's easy for you to write them and for me to read them without the hassle of printing them on paper.
Term paper
During the second half of the semester each of you will choose a topic, either from a list I provide or of your own choosing (vetted by me), to research and write a 8--10 page paper about. I will give you a fair amount of latitude when choosing a topic as long as it's within the bounds of the material we are covering for the course. This will be a survey paper, which assumes a lay audience.
Evaluation
Your grade for this class will be determined using the following rubric:
- Exercises - 25%
- Labs - 25%
- Journal - 15%
- Term paper - 20%
- Class participation - 15%
My definition of class participation is showing-up, doing the work, and actively engaging your fellow students and myself in the enterprise of learning.
Disabilities
Please let me know as early in the semester as possible if there are any adaptations or accommodations you require, if there is any emergency medical information I should know about, or if you might need special arrangements in the case the building needs to be evacuated, etc . The Earlham policy is:
- Any student with a documented disability (e.g., physical, learning, psychiatric, vision, hearing, etc.) who needs to arrange reasonable accommodations must contact Academic Support Services and the instructor at the beginning of each semester. Accommodation arrangements must be made during the first-two weeks of the semester.
It is important to follow this procedure.
Assignments
Due Friday 25 February
- Write-up due, Lab 2: Holy Pigeon P#$! Batman, it's Penelope Poison!.
Due Sunday 20 February
- Data collection for Lab 2: Holy Pigeon P#$! Batman, it's Penelope Poison!, 11:00 - 19:00 (with dinner at the flat).
Due Saturday 19 February
- All previously assigned questions, journal entries, etc. are due by the end of the day. This is your last chance to catch-up on the work for the first part of the semester.
Due Friday 18 February
- Read chapter 10 (Astronomy) and chapter 11 (The Cosmos) in Science Matters.
- Develop at least 3 questions about concepts, technologies, etc. that didn't stick from the reading in chapters 10 and 11. Post these to your wiki journal in an entry titled Astronomy and the Cosmos.
Due Thursday 17 February
- Write-up a critique of the Technology and Sustainability lecture you attended on Wednesday evening. Content, structure, etc. are all fair game. Post this in your wiki journal in an entry titled Technology and Sustainability Talk.
Due Tuesday 15 February
- Following our visit to Kew Gardens, consider the following questions and write-up your response in a wiki journal entry titled Science at Kew:
- What science do they do at Kew? What evidence of scientific underpinnings did you find in the displays? Why is it important to society, that is why should society support the work Kew does? What are the principle near-term and long-term benefits that are likely to accrue from their work? Another way to ask this question is who benefits from their research and why? (Hint, they provide good information about these topics in their exhibits and on-line materials.)
- Bonus question (5 points) - Identify as many places as you can at Kew where you encounter the Fibonacci sequence (Wikipedia). List these in a wiki journal entry tittled Fibonacci at Kew. There is a very nice bit done by the BBC on the Fibonacci sequence here.
Due Monday 14 February
- Write a short review of Greenland and post it in your journal on the wiki. Consider the accuracy of the information presented and the effectiveness of that medium, and that particular play, as a tools for shaping public opinion about climate change, clearly label this entry Greenland Review.
- Reflect on what you learned over the past couple of weeks about climate change and consider the questions below. Write-up your thoughts about all this in your journal on the wiki, clearly label this entry Reflections on Climate Change.
- What do you believe the take-away message to be?
- Which of the modalities did you find most effective at communicating that message: reading, museum, or theatre? Why?
- What's different about the message here in England than what you hear in your home country about climate change? Different than at Earlham?
Due Friday 11 February
- Greenland at the National Theatre, see the page for the details.
- Before the play listen to a segment from This American Life about climate change and public opinion about it. This segment is embedded in a show called Kid Politics, the segment you should listen to is Act 2, Climates Change, People Don't, begins at 24:27.
Due Tuesday 8 February
- Read chapter 4 (The Atom) in Science Matters.
- Develop at least 3 questions written or emailed to me before class about concepts, technologies, etc. that didn't stick from the reading in chapter 4.
Due Monday 7 February
- Teach yourself a couple of new MediaWiki formatting commands. Using the edit link (at the top of the page) to view the source of say a Wikipedia page that does something you think is cool is a great way to learn how to use the markup language. Just press the Cancel link (at the bottom of the page) when you are done.
- Consider your first experience at Atmosphere in light of the questions listed below. Write-up your thoughts in your journal on the wiki, clearly label this entry Atmosphere I. This entry should reflect some of your new found skills from item 1. above.
- Which specific aspects of climate change did the designers of atmosphere choose to focus on?
- How well sourced was the science and technology discussed in the kiosks?
- What was the most surprising thing you learned?
- Which of the interactive kiosks did you find most engaging? Why?
- Which of the interactive kiosks did you find least engaging? Why?
Due Saturday 5 February
- Write-up due, Lab 1: Where Am I?. Send me email when it's done so I know when I can review it.
Due Tuesday 1 February
- Read chapter 14 (Earth Cycles) and chapter 19 (Ecosystems) in Science Matters. Come to class on Tuesday with 3 or more written or emailed to me before class questions about the material.
Due Monday 31 January
- Start work on the write-up for Lab 1: Where Am I?, come to class with questions, etc.
Saturday 29 January
- Greenwich excursion, field work for Lab 1: Where Am I?
Due Friday 28 January
- First written responses in your wiki-based journal due, the question to address is:
In your view what are the three most important challenges facing society in the near term (say 50 years)? Why are each of these so important? What does science have to offer for each? What does technology have to offer for each? Your entry should clearly address which are science based and which are technology based. You can describe both science and technology approaches for each of the problems you identify.
- You can find your wiki-based journals for this class here
Due Tuesday 25 January
- Read the pages listed under Greenwich on the Supplemental Material page
- Come to class with any questions you have about what they cover, the implications, etc.
Due Monday 24 January
- Read Chapter 2 (Energy) in Science Matters.
- Come to class with a written list of questions about concepts, etc. that didn't stick from chapters 1 and 2.
Due Tuesday 17 January
- Read Henry Petroski's short article about science and technology which can be found on the Supplemental Material page
Due Monday 16 January
- Read the Introduction and Chapter 1 (Knowing) in Science Matters.
Due Tuesday 11 January
- If you haven't completed the reading for Monday do so now.
Due Monday 10 January
- Read the syllabus and general education rational, come to class with questions, etc.
Lab 1: Where Am I?
Overview
There are lots of interesting and historic places in Greenwich, there are also some places that are fairly ordinary. Working in your lab groups (see below) you will locate one such ordinary place, determine where it is a couple of different ways, measure the shortest distance from that point to the Prime Meridian, and note some additional physical markers.
Figuring-out where you are and how far it is to other things is the first step in mapping the world around us. This lab is designed to give you first-hand experience with some of the tools and processes to do that measuring and mapping.
Once you have completed the data collection in Greenwich you and your lab partners will analyze the data and describe the results in a lab report which will be due next week.
Make sure that at least one person in each lab group brings a laptop with them to Greenwich. It will make some aspects of the lab much easier. If you have a minute to install Google Earth before tomorrow that would be even better.
Lab Groups
Listed below are your scientifically chosen lab groups along with a description of the fairly ordinary place you will need to locate.
- Red: Lily, Bill, Emily - The steps leading from the sidewalk to the front entrance of the Our Lady Star of the Sea church.
- Green: Krystnell, Johanna, Spencer - The intersection of May's Buildings Mews and May's Court.
- Yellow: Mamus, Ivan, Vivian - The distal end of Croom's Hill Grove.
- Black: Eva, Gillian - The steps leading from the sidewalk into the courtyard of the museum devoted to cooling oneself.
- Purple: McKayla, Ben - On the sidewalk near the marque of the home of Greenwich's thespians.
Details
Once you have located your spot you will need to:
- Determine the latitude at that spot using at least three different tools/methods.
- Determine the longitude at that spot using at least three different tools/methods.
- Determine the elevation at that spot using at least three different tools/methods.
- What is due North of that spot? (E.g. "a house with blue shutters", or "an oncoming car...")
- What is due South of that spot?
- Determine the minimum distance in meters from that spot to the Prime Meridian using at least two different tools/methods.
Hint: There is a really big, sort of blue/green, local reference point for elevation running alongside Greenwich.
Tools and Methods
There are a number of different ways you can determine latitude, longitude, elevation and distance:
- A well reasoned and reasonably accurate estimate.
- Measuring by angle of elevation and distance.
- Measuring by calibrated human pace.
- GPS device (I have two to loan for 1 hour time blocks on Saturday when we're in Greenwich)
- Google Earth
Each of these tools has their own strengths and weaknesses, sources of error, etc. One aspect of this lab is to learn what they are and how to best work with them. At least one person in each group will need to install Google Earth on their laptop.
Note that not all of the tools/methods need to be employed while you are in Greenwich, that is once you have a handle on the spot you could sit at FIE and use Google Earth. All of the other tools/methods require your physical presence at the spot to employ them.
Report
Each group will write-up a lab report in the Lab Notebooks section. There is a very simple template there for each group to start with. Your write-up should include:
- A description of the task at hand and your approach to the work.
- A description of the spot you are working from.
- The measurements as listed under Details above, for each of the tools/methods, organized in tabular form.
- A discussion of the sources of error associated with each of the tools/methods you employed and the likely range into which the correct answer is likely to fall for each of them.
- The raw data, that is each value read (at minimum 3 values for each data point) for each tool/method you employ for a given measurement.
Extra Credit: A basic visualization which utilizes an aerial image with a placemark at the spot, labeled with the coordinates, and visual indications of the "zone of error" for each of the tools/methods you employed.
Neatness and organization count, significantly.
Questions
Once you folks begin working on the lab I will be available to answer questions, loan tools, make smart remarks, etc. You can find me at roughly 51.4816 -0.0099, probably drinking coffee.
Lab 2: Holy Pigeon P#$@ Batman, it's Penelope Poison!
Overview
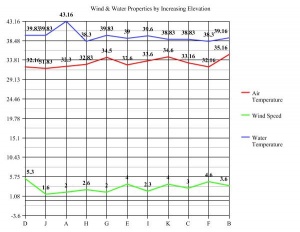
London is in a pickle, and it is your job to help them out of it. The notorious Penelope Poison has threatened to release a toxic substance into London's water supply, in order to thwart her plan the emergency response people need visualizations which show the water temperature, air temperature and wind speed and direction at a number of water bodies located in central London.
You will all need to show-up at location 1 (see Questions below) before/at 11:00 on Sunday morning. I will be available starting at 9:30 at that location to hand-out instruments, answer questions, etc. At least one person from each group should plan on being there before 11:00. I will be leaving that location at 11:15 sharp so stragglers will need to hope their group waits for them.
There are lots of important details embedded in this lab description, reading it closely and carefully will be worth the time.
Lab Groups
Listed below are your scientifically chosen lab groups:
- Red: Lily, Bill, Emily, Ben
- Yellow: Mamus, Ivan, Vivian, Eva
- Green: Krystnell, Johanna, Spencer, McKayla, Gillian
Details
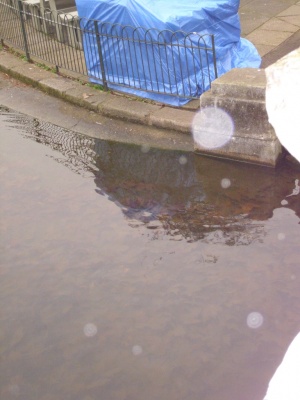
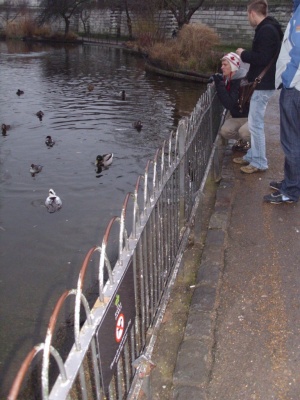
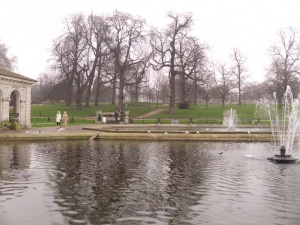
Just before the Director of Emergency Response (Mr B. Cheese) left town for an undisclosed location he took pictures of the locations that need to be sampled, you can find them at http://cs.earlham.edu/~charliep/EnglandProgram/Lab2. Unfortunately he was in a rush and neglected to label any of the pictures.
- Identify where each of the 11 images were taken. Remember that digital images often contain more information than meets the eye.
- At each of those 11 locations record the following:
- A picture that duplicates as near as possible the one you were given of that location.
- The latitude, longitude and elevation of the location (if you have a GPS in your kit use that, if not use Google Earth).
- An estimate of the wind direction and speed at that location when you are there.
- The temperature of the water body in the picture at that location.
- The air temperature when standing where the image was taken at that location.
Remember to record at least three readings for each parameter at each location. Later you can aggregate each of those groups of three readings into a measurement of that parameter for that location. Think about how to "reset" each instrument so you can record three independent readings of each parameter.
Google Earth is a tool just like the physical ones, when you use it to measure e.g. the latitude/longitude/altitude you should develop and document a procedure for taking three readings just as you are for the other tools.
To measure the wind speed you can estimate it using the Beaufort scale. The wind direction can be determined with a small scrap of paper and a compass or GPS in compass mode.
Measuring the air temperature will depend on which kit you have. The thermocouple and the combination compass/thermometer can take direct readings, the infrared thermometer will require a little cleverness to enable it to measure the air temperature.
Each group must make their own measurements, this will enable the emergency responders to compare the values obtained with different instruments and people to ensure that they react properly. You can share techniques and ideas among your groups but not data.
Each of these tools has their own strengths and weaknesses, sources of error, etc. One aspect of this lab is to learn what they are and how to best work with them. At least one person in each group will need to install Google Earth on their laptop.
Normally you would take air and water samples at each location as well, since Penelope Poison is threatening to act soon you don't have time for that now.
Red Instrument Kit
- Combination compass/thermometer
- Uni-T multimeter with point contact temperature probe
Yellow Instrument Kit
- GPS
- Maplin thermocouple thermometer
- Compass
Green Instrument Kit
- GPS
- Infrared thermometer
- Compass
Report
Each group will write-up a lab report in the Lab Notebooks section. Your lab report should include the following elements:
- A description of the problem you were given and your approach to solving it.
- For each parameter the procedure you followed to obtain the readings and measurement.
- A tabular display of each measurement of each parameter at each location.
- An analysis of the measurements describing any patterns that are evident and your thoughts about why they might be present.
- A small/simple gallery of the images you took at each of the locations with descriptions of the actual place (e.g. Looking North from the South side of the fountain in Bethesda Terrace in Central Park).
- An appendix with the readings and measurements for each parameter and each location.
- For each of the instruments you used determine the error associated with it. If references are available for the instrument use those values (and document the source), if not make a reasonable estimate and document how you came to it.
- A visualization of the data, preferably as an overlay on a map or aerial image of the overall area in question.
- A short statement from each group member explaining what they contributed to this lab.
There is a very simple template there for each group to start with, you should not feel bound to the format that's there but you must be sure to address each of the items listed above.
Neatness and organization count, significantly.
Visualization
Each group will create a visualization with the parameters they measured. We'll discuss the different approaches to this over dinner on Sunday and in class on Monday.
Questions
Before you start and once you are working on the lab I will be available to answer questions, etc., here's where to find me when:
- Between 09:30 and 11:00 you can find me at roughly 51.510509, -0.127060
- Between 11:30 and 14:30 you can find me at roughly 51.502998, -0.165623
- After 15:00 you can find me at roughly 51.511393, -0.127091
I won't be checking email or text messages between 11:00 and 15:00 but I will be available for F2F consultation at the locations/times listed above.
Lab Notebooks
Lab 1: Where Am I?
Lab Write-up for Group Red
Albert Greene, Lilly Cutler, Emily Van Cise Lab One: Where Am I? Science, Technology, and Society 2/4/2011
Part one: Description and Method
We were charged with exploring the various means of identifying location, and by extension, navigation. To simplify our overall project, we were given a location within walking distance in the epitome of constructs, the prime meridian in Greenwich. Our task was, once provided with a location by our instructor, to identify the coordinates of this point using three different methods available in the modern era. Although humans have developed an impressive array of devices and methods with which to navigate, we chose to utilize three divergent tools. First and the most fundamental is general reason and understanding of the structure which serves as the foundation for the human enterprise of navigation. Our second method was to employ Global Positioning Satellite technology, better known as GPS. Finally, we used a program known as Google Earth, which generates a three dimensional simulation of the earth based on satellite images and computer modeling.
Our use of general logic incorporates a number of assumptions that reflect the fundamental design of latitude, longitude, directionality, elevation and space. We could deduce the latitude by noting that the city of London sits comfortably on the N51* mark, and further, that the Thames is around the 28 minuet mark. The location we were given sat half way between the ends of Greenwich Park, a mile long patch of grass. We could then claim that the latitude of our location was between points 0 and 1000. We determined longitude by measuring the step of one metric Bill whose pace is one meter per step. We counted the calibrated step to determine how far we were from the prime meridian which would give us the longitude. Objects north and south of us could be identified by noting that the sun rises in the east and sets in the west. Given the time, we could note its accent or decent and determine north and south relative to its location in the sky. Finally, given that the Thames is at mean sea level 0, and that the Greenwich observatory is 153 feet high, we could deuce our relative elevation to both points. After looking at our findings utilizing digital and satellite technology, it was surprising how accurate general reason was.
Global Positioning Satellites technology is relatively simple. Given a GPS, a devise that communicates with satellites above, we merely read off and record our location. The satellites, which are in orbit above the earth, cover a circular area and the devise finds our location by identifying the overlap of the areas covered. We were given latitude, longitude, elevation and could place landmarks. The devise can measure the distance between these two points and give us the length in meters.
Google Earth, a program which generates a “perfect” model of the earth is also an incredibly simple method for divining our location. We merely needed to find Greenwich via the search option, find our location specific spot, which was conveniently marked as a point of interest. Moving the cursor over the point would give us latitude, longitude and elevation. The program also includes a measure function and provides a wide array of measurements for points you place on the map. Using these three methods we were able to find out where the heck we were.
Part two: Description of Location
We were told to orient ourselves on the steps of Our Lady Star of the Sea Church (see below). A Catholic Church located on Crooms Hill Road in Greenwich, London. The road runs parallel to the Greenwich park grounds on the West side up a steep incline. Down the hill, to the north we saw a white house with metal guardrails on the roof. To the south, up the hill, we could see a red brick house with white trim just past a grassy noel. Across the street, toward the prime meridian was another incline fenced off by a metal gate and thick shrubbery. This barrier was a big reason for having a margin of error greater than ten meters with our measurement of calibrated stride. All that remains to be said at this point is that the area is lovely and that you can find more information on the church at http://www.portcities.org.uk/london/server/show/conMediaFile.5351/Our-Lady-Star-of-the-Sea-Church-Crooms-Hill-Greenwich.html.
Part Three: Tabulation of findings:
Latitude
GPS- N. 51 28.585 +/-5-6m
Google Earth- N 51. 28 349
Reason- N 51. 28. (000-1000)
Longitude
GPS- W. 000. 00 346 +/-5-6m
Google Earth- W 000 00. 352
Reason- W 000 00.360 +/-
Elevation
GPS- 37m
Google Earth- 37m
Reason- 38.25
Distance from Prime Meridian
GPS- 428 m
Google Earth- 417m
Reason- 360m
Part Four: A Discussion of Error
In terms of general logic we used our knowledge of location to determine our latitude. We already knew our approximate location. We generally guessed where we were, but were unable to know exactly where we were in terms of latitude, elevation, and longitude. We used a calibrated step, so this was not a perfect measure of distance. In terms of GPS, it is accurate up to five or six meters. So we know we were accurate up to five or six meters. In terms of Google Earth, the cursor placement could be relative and is not necessarily completely accurate with the location.
Part Five: Raw Data
GPS coordinates
Longitude W. 000. 00 346 +/-5-6m
Latitude N. 51 28.585 +/-5-6m
Elevation 38m
Distance from meridian: 428m
Google Earth
Longitude: W 000 00. 352
Latitude N 51. 28 349
Elevation 111 feet 37 m
Distance from prime meridian : 417m
General Logic
Latitude: N 51. 28. (000-1000)
Longitude: number of M. from meridian. W 000 00.360
Distance from meridian# of steps x 1 step360+- 15 steps
Average rate of bill+ 1 m
Elevation halfway up Cromwell hill from the Thames which is +5 m from sea level, 153 feet at top of hill, or 46m somewhere between 10 m probably 153 div 3=51 mult .75= 38.25 m above sea level
What is north: White house with metal guard rail on roof
What is south: red house on hill with white trim
Path taken during calibrated measurement march:
Reviewed - 21 February 2011
Lab Write-up for Group Green
Introduction
Description of task and approach
Despite being a completely arbitrary line, the prime meridian holds a great deal of significance for human navigation. During our visit to Greenwich, we used the prime meridian as a reference point for our assigned location. We estimated the latitude, longitude and elevation of the given spot using a GPS, a compass and human estimation. We used footsteps to determine our distance from the Royal Observatory as well as labels on a nearby lamppost.
Description of the spot
For this lab, we were directed to find the corner/intersection of May's Buildings Mews and May's Court. Quickly, we recognized (both through googlemaps and observations of the human eye) that our location was approximately on the same latitude as the Royal Observatory. Our estimate was that we were located 25 m South of the Royal Observatory’s latitude. We first took a description of what was directly North of our location. Standing on May’s Buildings Mews (a brown loose gravel road/driveway) we used a compass to look North and noted a black gate reading “The Grange”, on one side in stone, and “52 Mays Buildings Mews”, on the other side of the gate. Turning around 180° we now took observations of the location directly South of our location. In this direction ran May’s Court North to South. Along this short road were several residential homes identified as “Beaver’s Housing Society”. More directly South of our location was the front yard and the birdfeeder. Looking to the East we identified a lamppost with elevation and longitude markings. We estimated this lamppost to be about 25 meters east of our location, and it proved instrumental in many of our ‘Human Estimations’.
Data Collection
Measurements & Raw data(raw data in bold)
1) LATITUDE:
Method 1 [Human Estimation]
royal observatory (51° 28’38.56”) – 25 m = 51.47737777766666° – (25m / 111248.24m) = 51.477153055010373°N
(lengths of degree latitude at 51° = 111248.24m)
Method 2 [GPS]
51° 28.633’ = 51° + (28.633 / 60) = 51.477216666°N
Method 3 [GoogleEarth]
51°28'37.82"N = 51° + ((28 + (37.82 / 60)) / 60) = 51.4771722222°N
2) LONGITUDE:
Method 1 [Human estimation/lightpole]
0° 0.381’ + 21 m = 0.00635° + (21 m / 70,197.65m) = 0.00664915°W
(length of degree longitude at latitude 51° = 70,197.65m)
Method 2 [GPS]
0° 0.372’ = 0° + (0.372 / 60) = 0.0062°W
Method 3 [GoogleEarth]
0° 0'22.42"W = 0° + ((0 + (22.42 / 60)) / 60) = 0.0062277777°)
3) ELEVATION:
Method 1 [Human estimation/lightpole] – 13 m
Method 2 [GPS] – 14 m
Method 3 [GoogleEarth] – 22 m
4) DUE NORTH:
A black gate and driveway for number 52 Mays Buildings Mews (written in stone next to the gate says “The Grange”)
5) DUE SOUTH:
Mays Court…and a housing complex called Beaver’s Housing Society…more specifically the birdfeeder in the front lawn
6) SHORTEST DISTANCE FROM PRIME MERIDIAN:
Method 1 [Human Pace]
184 paces (estimated at .5 m/pace) X 2 = 184 m
Method 2 [GoogleEarth]
432.3 m
Data Analysis
Discussions of sources of error
Sources of error made during data collection can be attributed to several factors. In choosing to use Johanna's footsteps to measure distance, we realized that we had no way exact way of ensuring that each footstep was equal to the next. The circumference of Spencer's wheelchair would have been more exact, and originally we found that circumference (using the tiles in the TexMex restaurant) to be two meters. Our first objective was to measure the distance between the spot of our location and the nearest lamppost. That alone was quite a tedious challenge using Spencer's wheelchair as it proved very difficult to follow the exact amount of wheel rotations. The group decided that it would be an inefficient use of time to attempt this method in measuring our distance from the Royal Observatory. Our next solution was to figure out Johanna's pace. Knowing the circumference of Spencer's wheel we compared one rotation to two of Johanna's steps. It took her four steps to go the exact same distance as a whole rotation, therefore it was estimated that one step was equal to 1/2 a meter. Although we are confident in this estimation we cannot be as confident in the consistency of Johanna's steps and therefore the human estimation involved in "Longitude", "Latitude", and "Distance from Prime Meridian" must account for a certain level of error.
Furthermore, when calculating the "Latitude" and "Distance from Prime Meridian" we noticed that we were extremely close, but not exactly, to the same latitude as the Royal Observatory. Using and eyeball estimation we attempted to walk a parallel line to the Prime Meridian from our location to the spot lying on the same latitude as the Royal Observatory (also using a compass to ensure East remained in the same general direction). Again with Johanna's pace this estimate came out as 25m (accounting for possible error in our human estimation on "Latitude" as explained above). From this location (noting the GPS longitude coordinate remained the same as our initial location) we decided an accurate measure of our distance from the Prime Meridian could be found by estimating the distance between us and the Royal Observatory. A number of sources of error occurred in this process. It would be a severe physical challenge to walk from this location directly to the Royal Observatory because of the path leads up the hill, not to mention that a measurement of Johanna's pace up the hill would be an inaccurate measurement of the actual distance since it would include a vast change in elevation. Our solution was to make a human estimation of a halfway point between the two locations, measure the distance between our current location and there, and then double that measurement. Obviously, our estimated halfway point was recorded through no more than the human eye and accounts for some of the possible error. Also, while walking to this point, we ran into a wall, stopped counting the pace while we walked perpendicular to our path until coming to an entrance to the park, where we again continued along our path and pace measurement. This pause in our measurement could also be the cause of some of the inaccuracies.
It is also possible that the degree of error associated with the GPS system and the satellites that it corresponds with is an issue which also may have affected the data points we obtained. When analyzing the results given by 'Google Earth' we looked for 0 degrees longitude and noticed that the spot it directed us to on the map did not appear to run through the Royal Observatory but a significant distance to the East of the Royal Observatory. This peaked our interest and with some basic research on wikipedia we discovered that a GPS will not indicate 0 at the Royal Observatory because GPS' operate according to a "GPS Prime Meridian" that is actually located approximately 100 meters east of the Royal Observatory. This is actually the Prime Meridian used by the International Earth Rotation and Reference Systems Service (identified in this context as the IERS Rference Meridian) specifically because it is the GPS Prime Meridian as identified by the United States Department of Defense. It is the current reference point for WSG84 (World Geodetic System 1984). Ironically, wikipedia identifies 2010 as the year in which WSG84 will no longer be valid after 2010. Anyways, the IRM or GPM is 5.31 arcseconds east of the meridian circle at the latitude of the Royal Observatory (specifically, 102.5 meters). Interestingly enough, this difference is attributed the legacy left behind by the TRANSIT, the first satellite navigational system. The TRANSIT surveyed coordinates in a non-Earth centered ellipsoid, yet has used those coordinates in Earth-centered ellipsoids, accounting for the differences. This helps to explain the source of error presented when using the GPS.
From everything we can tell, GoogleEarth appears to be the most accurate. However, we are not experts in using the program and it too could present inaccuracies. For instance, many of the coordinates it provides depends on the very specific location of the cursor. Try as we might, we cannot say with complete certainty that our cursor was on the exact locations we desired. One question we are left with deals with the elevation GoogleEarth provided. Our "human estimation" was based off of the lamppost nearby which read 13m. We felt our location on the same elevation as this lamppost, and the GPS helped validate that estimate by showing 14m. However, GoogleEarth identified the elevation at our location as 22m, which is a large enough difference to question it as a source of error.
Results
Reviewed - 21 February 2011
Lab Write-up for Group Yellow
Group Report 1: Where am I? Yellow team: Ivan, Mamus, and Vivian.
Our focus point was the distal end of Croom’s Hill Groove. We used three different methods/approach to identify our destination which includes Google earth, GPS and method of estimated (natural way). We used the GPS, Google earth, proximate measures, timer, camera and a compass as our tools. Below is a description of our identification by the use of longitude, latitude, elevation and distance.
Latitude: GPS reading: 51.47728 Google earth: 51.477543 Estimation:
PICTURE 1
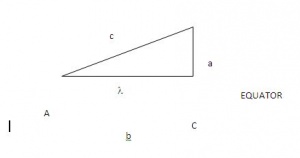
Using Google Earth, we measured the distance from to the Equator to the closest approximate point to Croom’s Hill, Greenwich England. At this point we then used general knowledge (with a little help from Google) to establish the distance from the Earth’s core to the surface. Using the Pythagorean Theorem, we found the angle between AB and AC, which represents the an estimation of latitude for the purposes of this experiment.
In the diagram, a= 3441.58 miles (distance from Equator to Greenwich, England b=3975 miles (distance from Earth’s center to its surface) c= side needed in order to complete equation finding angle of latitude.
c =sqr(1915^2 + 3975^2 c =5257.860…
Finding A
A=sin(a/c) A= sin(3441.58/5257.86) A=.inverse of sin (.608) A=37.45° Therefore the angle of latitude using estimation is 37.45°.
Longitude: GPS: 00.000765 Google earth: 00.007876 Estimation: For every 15 ° of longitude, there is a 60 mins difference in time. We were 8 minutes away from the prime meridian of 0°, so our calculation of the longitude degree was as follows: 15°=60mins ???=8mins (15*60)/8 2°
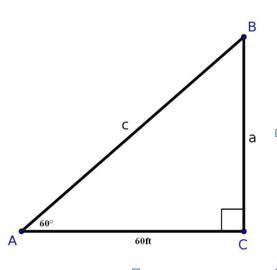
Elevation: GPS: 18.5 ft but we changed this to 60ft through computer calculator. Google earth: 59 ft Estimation: By the natural arm method, we estimated the angle from Greenwich to our destination to be 60°. As shown on the triangle below we used the cosine and Pythagorean theory to find our elevation.
PICTURE 2
AC/BC= Cos a°
60ft/BC=Cos60°
BC= 60Cos60°
BC=60(0.5)
BC=30ft
a2+b2=c2
602+302=c2
3600+90=c2
?4500=c
C=67.08ft (our angle of elevation)
Distance:
Google earth: 540m
Estimation:
We used Ivan’s feet which we approximated to be 1 step is equivalent to 1 meter. Evan walked 10 steps in 07:48sec, which we approximated to be 8secs, so it takes one person to walk 10meters in 8 secs. We walked from our point (Croom’s Hill Grove) to in approximately 8 mins. So below are the calculations of the distance it took us from our point to the prime meridian.
10meter=8seconds ???=480seconds (8*60) (10m*480s)/8s = 675m
Below are pictures of the North aside and a description.
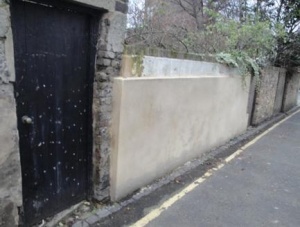
North side description: Narrow road Houses in form of flats with tiles on the roof Cars parked on the right side of the street, near houses.
PICTURE 3
South side description: A garden Garbage Dead end with a small/shallow wall.
PICTURE 4
Weaknesses:
Time was not accurate, as it depends on ones pace of walking, the answer (time it took us to walk) could vary depending on one’s speed.
The GPS is not as accurate. Their accuracy will be within about 10 to 50 feet (3 to 15 meters), 95% of the time.
Reviewed - 21 February 2011
Lab Write-up for Group Black
Introduction
Our task was to estimate and determine the distance between the Fan Museum, at 12 Croom's Hill, London SE10 8ER 020 8305 1441, and the Prim Meridian, to find the latitude, longitude, and elevation, and determine the surroundings of the Museum (what was north and south of it). Our approach to these tasks utilized a GPS, a compass, a scarf, Charlie’s angle finder, Google Earth and Google Maps. While on location, we walked the distance from point A to point B once with the GPS and a second time using a scarf as a measuring device (the scarf was not a accurate as the our other means of measurement). In Greenwich we also looked at the surrounding area (N and S), looked at the street poles to find the longitude and latitude and used the angle finding device to find the elevation of our museum from sea level.
The location from which we were working was in a quiet part of town on a calm street where the Fan Museum was tucked away on the edge of a residential area.
Data Collection
Due North: Greenwich Theatre
Due South: Residential building
Distance between spot and prime meridian found by: Scarf, GPS, Google Earth
Data Analysis
It was hard to find the accurate distance between spot and prime meridian because the road we used to find the distance on was not a straight line and we were also faced with obstacles like a wall on our way therefore we had to go around the wall and that might have produced some errors in our calculations. We also went halfway and estimated the distance of the other half; this might not be accurate because our judgment of half way might not have been the real half way of the total distance we were measuring.
Results
1. GPS 2. Google Earth 3. lightpost
Latitude 1.N 51.28° 2.N 51.28° 3.N 51.28°
Longitude 1.0°00'28.83" 2.W 0°00'28.83" 3.W 0°00'28.83" W
Elevation 1. 13m 2. 13m 3. By estimation 13m
Reviewed - 21 February 2011
Lab Write-up for Group Purple
Introduction
Our task was to find the Latitude and Longitude of the Greenwich Theater using three different methods. We were also tasked with finding the elevation and distance to the Prime Meridian using two different methods, and what was due south and North of the location. Here is the methods we used to find the information.
- Latitude
- Google Earth
- Reasonable Guess
- Using a picture taken off Google Earth with two known degrees of latitude, then estimating where our location lies between them
- GPS
- Longitude
- Google Earth
- Reasonable Guess
- Figure out the distance to the PM, convert the linear measurement to degrees longitude, then add or subtract that from the 0 degrees (The PM)
- GPS
- Elevation
- GPS
- Google Earth
- Distance to Prime Meridian
- Google Earth
- GPS track feature
- Due South
- Compass
- Due North
- Compass
The Greenwich Theater was located several hundred meters from the Thames and had its back to the Royal Naval College. While the theater itself is fairly large, we were only concerned with the front entrance which was a small awning overlooking a fairly quiet street. The Rose and Crown Pub was next door, which happened to be due North of the entrance. The Fan Museum was due South.
Data Collection
- Latitude
- Google Earth:57.469377
- Reasonable Guess:57.45
- GPS: 51.47937
- Longitude
- Google Earth: -0.007924
- Reasonable Guess:-0.00171
- GPS: -0.00804
- Elevation
- GPS:10.05 M
- Google Earth: 13 M
- Distance to Prime Meridian
- Google Earth: 118 Meters
- GPS track feature:121 Meters
- Due South
- Fan Museum
- Due North
- Rose and Crown Pub
Data Analysis
- GPS - according to the Garmin website, our GPS, the Etrex Vista C, is accurate within 30 meters 95% of the time. After importing our points to Google Earth, it looks like our points are within a tighter range. If the GPS has been calibrated, it is supposed to calculate the elevation within 3 meters of accuracy.
- Google Earth - Google Earth's elevation is typically within +_ 10 meters. We were unable to find out the accuracy of the latitude and Longitude settings, however they do offer a disclaimer say it is not accurate navigation. Several websites claimed that it is hard for Google Earth to be accurate due to how they map the area and how they stitch the various photos together.
- Reasonable Guess - this was not very accurate, especially when we did the calculations using the distance from the PM converted to degrees to calculate the Longitude.
- Compass - This was very accurate because we were looking at big targets. For instance, the Rose and Crown pub, situated five meters away occupied several degrees away from due North, so even if were were significantly off we would still have come up with the same result.
Results
Using a variety of methods we were able to return a variety of results. Generally the newer the technology the better it was. Obviously our guesses lacked the accuracy of the GPS and Google Earth. Interestingly enough, Google Earth is not noted for its accuracy for a variety of reasons including updates in the software used to stitch it together. The GPS was the only tool with readily available data on its accuracy and it did not turn out to be that precise. We do not have any raw data, we will make sure to collect it in the future.
Extra Credit
File:Earthlab.pdf Extra Credit
Reviewed - 21 February 2011
Lab Write-up for the Orange Group (Charlie)
- 22 February 2011
- N.B. - I did not collect any data or do any of the work described below, it's purely an example of one way to write-up a lab report. The procedures, error analysis and such are accurate, just the data has been faked.
Overview
Greenwich, England is home to the Prime Meridian, the arbitrary line that signifies 0 degree longitude for global navigation. The lab assignment, Where am I?, asks us to determine where a particular location in Greenwich is located using different tools/methods to determine the latitude, longitude, elevation and distance to the Prime Meridian of that location.
Data Collection
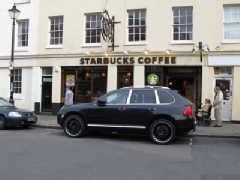
The spot I was assigned was just outside the Starbucks in Greenwich:
The lab instructions specify that we should use three different tools/methods to determine the latitude, longitude and elevation. Listed below are the choices I made:
- Latitude - GPS, Google Earth, and estimation
- Longitude - GPS, Google Earth, and estimation
- Elevation - GPS, Google Earth, and estimation
Next the instructions ask us to determine what is due North and due South of that location:
- North - compass and visual observation
- South - compass and visual observation
Lastly the instructions ask us to determine the distance from that spot to the Prime Meridian using two different tools/methods, I used Google Earth and estimation for this quantity.
Equipment and Procedures
- Garmin etrex handheld consumer GPS unit, software version 3.5.0
- Using the GPS involves powering it on, waiting for it to acquire enough satellite signals, noting the margin of error, and then switching the mode to waypoint which displays the latitude, longitude, and elevation. To obtain three readings I slowly spun in a full circle while chanting "umm" and then stopped and waited for the GPS to produce a new reading.
- Google Earth software, version 6.0.1.2032 (beta), running under OSX 10.6.6
- Once Google Earth is launched you can enter the location of interest in the search box and then zoom-in to the appropriate magnification for the task at hand. To obtain three readings I moved the mouse around on the screen and then returned it to the point of interest and re-read the latitude, longitude and elevation from the status bar on the bottom of the screen.
- Estimation using a 48 year old white male American with a background in science and engineering
- For the latitude I used the lamp post across the street and noted the latitude marked on it.
- For the longitude I used the lamp post across the street and noted the longitude marked on it.
- For the elevation I used the lamp post across the street and noted the elevation marked on it.
- For the distance to the Prime Meridian I calculated my pace by walking the length of the Cutty Sark 3 times, averaging the number of paces, and then dividing the known LOA of 280' <ref>Cutty Sark</ref> by that value. Using this method my pace was determined to be 2.5'. Using the hand-held compass as a guide I walked a line due East from the spot to the Prime Meridian keeping track of the number of paces. I then reversed my direction and walked back to the spot following the same path. I averaged the number of paces from the two trips and then multiplied that value by 2.5' to obtain an estimate of the distance.
- Silva bog standard hand-held compass, circa 1975
- While holding the compass on the outstretched palm of your hand, and using the centering bubble to ensure that it's level, a reasonably accurate reading can be taken if you hold your head directly above the compass and look straight down.
Measurements for each dimension were determined by averaging the three readings together.
Sources of Error
There are many sources of error, built-in and human, when using navigation instruments such as those employed for this lab. Below is a discussion of those as they apply to each instrument.
- GPS - Each GPS system has built-in error which varies depending on the specific unit, the number of satellites which are "visible" in the sky, and other internal factors. The Garmin unit I used displayed the accuracy of measurements each time it powered-up and acquired satellites. Each time I used it in Greenwich it stated that it had 3m accuracy. Greenwich is also home to the GPS Meridian, the 0 degree longitude for the GPS system. This meridian lies approximately 100m East of the Prime Meridian <ref>Prime Meridian</ref> which can cause confusion when using a GPS to measure the distance from a given location to the Prime Meridian.
- Google Earth - It's difficult to determine exactly what the internal accuracy of Google Earth is, the variety of sources used for the imagery and the variety of resolutions further confound matters. According to the Resolution and Accuracy section of the Wikipedia article on Google Earth <ref>Google Earth - Resolution and Accuracy</ref> London's imagery is high resolution. When using Google Earth to determine latitude, etc. the largest source of error is probably in the positioning of the mouse pointer. Not all platforms support changing the pointer from the default hand which is difficult to use to with any precision to something like an arrow which would improve the precision.
- Compass - The user must hold the instrument level, manually account for declination (approximately -2°25' in London) <ref>Magnetic Declination Explanation</ref> and parallax in reading the instrument are the primary sources of error. Compared to the other sources of error the magnetic declination in London is insignificant.
- Estimation - It's difficult to walk at a consistent pace over more than a short distance, say a couple of hundred feet, finding a straight path between two points in a city such as Greenwich is also difficult. One often has to make a "jog", going North or South for a distance around a fence, etc. before continuing to travel East.
Results
| Dimension | Instrument | Measurement |
|---|---|---|
| Latitude | GPS | xx.xx +/- 3m |
| Google Earth | xx.xx +/- 3m | |
| Estimation | xx.xx +/- 3m | |
| Longitude | GPS | xx.xx +/- 3m |
| Google Earth | xx.xx +/- 3m | |
| Estimation | xx.xx +/- 3m | |
| Elevation | GPS | xx.xx +/- 3m |
| Google Earth | xx.xx +/- 3m | |
| Estimation | xx.xx +/- 3m |
Directly North of the location is the intersection of two roads.
Directly South of the location is something really interesting.
The distance to the Prime Meridian as determined by Google Earth is xx.xx +/- 10m, by estimation it is xx.xx +/- 20m.
Appendix A: Raw Data
| Dimension | Instrument | Reading 1 | Reading 2 | Reading 3 |
|---|---|---|---|---|
| Latitude | GPS | xx.xx | xx.xx | xx.xx |
| Google Earth | xx.xx | xx.xx | xx.xx | |
| Estimation | xx.xx | xx.xx | xx.xx | |
| Longitude | GPS | xx.xx | xx.xx | xx.xx |
| Google Earth | xx.xx | xx.xx | xx.xx | |
| Estimation | xx.xx | xx.xx | xx.xx | |
| Elevation | GPS | xx.xx | xx.xx | xx.xx |
| Google Earth | xx.xx | xx.xx | xx.xx | |
| Estimation | xx.xx | xx.xx | xx.xx |
| Dimension | Instrument | Reading 1 | Reading 2 | Reading 3 |
|---|---|---|---|---|
| Distance to Prime Meridian | Google Earth | xx.xx | xx.xx | xx.xx |
| Estimation | xx.xx | xx.xx | xx.xx |
References
<references />
Lab 2: Holy Pigeon P#$! Batman, it's Penelope Poison!
England-2011-lab2-red
Group 1: Ben Smith, Lily Cutler, Emily Van Cise, Albert Greene
Problem Description and Approach
For this lab we were given the task of locating various points identified in pictures provided to us. We were able to find the locations in the pictures though the use of a computer program that could read the embedded Longitude and Latitude in the images. At each location we were to take measurements of the following: ambient temperature, water temperature, wind speed and direction. We also needed to confirm the latitude, longitude, and altitude of the locations we visited.
Data Collection
To collect this information we used several methods, each with varying levels of accuracy. We used a Uni-T multimeter to measure ambient and water temperatures. The compass we were given gave us our orientation upon which we based wind direction. We dropped a leaf or watched Bill’s exhaled smoke. The Beaufort scale was used to determine the speed of the wind. We then used Google earth to check our latitude, longitude and altitude.
Data Analysis
Good news! Penelope Poison will likely not be successful in spreading poison because it is too cold and windy outside to allow the spread of the poison.
Error Analysis
Uni-T Device- The error in using this device is +/- 1% +3. Depending on how long we waited to receive the temperature reading there may have been some human error, also in how we recalibrated the device before taking the next reading.
Compass- The error of the compass was mainly human error based on how close to the actual location the compass was being held and the angle with which it was being held and the consistency to which it was held at this angle throughout the data collection.
Leaves- The error of using leaves to find out the direction of the wind is that not the same leaf was used every time and the wind speed of the locations may have varied based on the surroundings and landscape. If the leaves that we chose to drop in the wind were wet they may have been heavier and harder to blow and allowed for some error in the data for the wind direction.
Pictures- Our ability to mimic and recreate the pictures was flawed because of our inability to recognize the landmarks in the original pictures and our attempt to retake the photos. This was a human error.
Images
Appendix A: Raw Data
| Location A | Location B | Location C | Location D | Location E | Location F | Location G | Location H | Location I | Location J | Location K |
|---|
! scope="row" | Longitude 1 | -0.142664' | -0.147532' | -0.18197' | -0.131919' | -0.16976' | -0.160808' | -0.174759' | -0.12766' | -0.160074' | -0.138764' | -0.175849' |} ! scope="row" | Longitude 2 | -0.142663' | -0.147536' | -0.181971' | -0.131941' | -0.169744' | -0.160836' | -0.174752' | -0.127667' | -0.160078' | -0.138727' | -0.175881' |} ! scope="row" | Longitude 3 | -0.142663' | -0.147537' | -0.181972' | -0.131955' | -0.169737' | -0.160836' | -0.174743' | -0.127649' | -0.160064' | -0.138728' | -0.175883' |} ! scope="row" | Latitude 1 | 51.50286' | 51.52532' | 51.506391' | 51.503448' | 51.505966' | 51.527818' | 51.507294' | 51.508194' | 51.504419' | 51.501745' | 51.516659' |} ! scope="row" | Latitude 2 | 51.502863' | 51.525323' | 51.506392' | 51.503456' | 51.505966' | 51.527759' | 51.507298' | 51.508199' | 51.504413' | 51.501745' | 51.510665' |} ! scope="row" | Latitude 3 | 51.502862' | 51.525328' | 51.50639' | 51.503453' | 51.505954' | 51.527769' | 51.507292' | 51.508205' | 51.50443' | 51.501754' | 51.510668' |} ! scope="row" | Altitude 1 | 41 ft | 105 ft | 97 ft | 36 ft | 50 ft | 122 ft | 70 ft | 69 ft | 52 ft | | 75 ft |} |! scope="row" | Altitude 2 | 41 ft | 105 ft | 97 ft | 36 ft | 50 ft | 122 ft | 70 ft | 68 ft | 52 ft | | 75 ft |} |! scope="row" | Altitude 2 | 41 ft | 105 ft | 97 ft | 36 ft | 50 ft | 122 ft | 70 ft | 69 ft | 52 ft | | 75 ft |}
Appendix B: Visualization
File:Charts.pdf Our Charts
File:Chartdata.pdf The data behind the charts
Charlie, i know you want these embedded, but i cannot figure out how... I think it has something to do with the file type?
Appendix C: Who Did What
Bill: For this lab, I was the official temperature taker, reading off the ambient and water temperatures. I also played a role in writing the lab report, taking care of part one, two and my section in part nine. I also found the Latitude, Longitude and altitude for the data spread sheet.
Emily: For this lab, I took the pictures and did the copy-editing. I posted the images and the raw data tables.
Ben: I downloaded the pictures, figured out how to read / import the geo-coding into Google earth. Looked at the location and planned our route. Built a spread to sheet to make data entry easier, entered data. Helped navigate and kept us somewhat found. Did visualization.
Lily: For this lab, I took the wind directions and the directions that we were facing. I also did the write up of the error analysis.
England-2011-lab2-yellow
Mamus, Vivian, Eva & Ivan
We just have to do a short write up for the visualization part.
Even without it, it is very clear to understand :)
Problem Description and Approach
Our task as the Yellow Team was to collect data from various water bodies in order to gauge the possible effects of releasing a toxic substance into London’s water supply. Dr. Obfuscation only provided photographs of the 11 locations where Penelope Poison threatened to release these toxic substances. We needed to figure out the geographical coordinates (latitude and longitude) of these locations, measure the air and water temperature, our elevation and note the wind speed plus direction at the times we were at these locations. Most importantly, we needed to figure out what the most accurate approach to collecting this data was, and what if any flaws there were in collecting this data. Time was also a factor to keep in mind, so we decided to tackle the location not in alphabetical order, but in the order of their proximity to one another.
Data Collection
Latitude, Longitude and Elevation using an eTrex GPS navigator
In order to determine the latitude, longitude and the elevation we used a GPS navigator powered by AA batteries. After turning the device on, three minutes were allowed to pass before readings were taken from the device for the first time in order to give it enough time to recognize enough satellites in order to provide accurate readings. For the second reading, the GPS device was turned off and on again, with a two minute interval before announcing the readings on the screen. For the third reading, the same procedure was followed except an interval of one minute was allowed before recording the readings produced by the device.
Wind direction using a compass and Tesco plastic bag
We laid the compass on a flat surface ( someone's palm, on the ground, on the surface of a flat bench) to help us determine the direction (north, west, east and south) of the location of the water body,. Three of the group members would each stand parallel to the compass with the plastic bag on their hand and observe the direction of the wind.
Wind speed using the Beaufort Scale
Wind speed was collected using the Beaufort Scale, a standardized method using visual estimations of the effect of the wind on objects such as a Tesco plastic bag, body of water and tees. When using the plastic bag, it was important to make sure that it was completely unfolded and had no residue of any sort inside it. It was held on at an arms length for 30 seconds. The extent of movement by the plastic bag was then visualized against the description of the Beaufort and awarded a number that matched the images of water used on the wikipedia page to distinguish between different wind speeds. When observing the water, it was important to make sure that the observer watcher its surface for at least one minute in order to establish a steady rate of motion on the surface of the water as a result of the wind. Lastly, when observing the trees, it was important to watch one specific tree for one minute in order to establish the effect of the speed of the wind on the leaves. This was done at every location.
Air and Water Temperature using the Maplin thermocouple thermometer
In order to measure the temperature for the air and water we used the Maplin thermocoupla thermometer device provided to us by Charlie Peck. This device consists of a screen for taking readings, an on and off button, a hold button, and a small metal rod attached to a wire on the back of the device for taking temperature measurements. At each location we went to we took out the rod, turned on the device, left it on for two minutes and then took the reading, copied the temperature reading onto our data sheet, then turned off the device for one minute and repeated this process twice more copying the respective readings onto our notes. Then using the same tool we put the small rod into the water at each location, here it was important to make sure the rod was immersed significantly in the water, we left the rod for two minutes, removed it from the water and copied the temperature from the screen. We then dried off the rod waited one minute and repeated this process twice.
Finding places
Nowadays there is more data stored in a single photo than can be seen in the photo itself. Information including when the photo was taken and with what equipment the photo was taken is available in data stored within pictures. Some cameras even have GPS devices incorporated into their mechanics allowing them to store the coordinates of the location at which the photo was taken (geocoding). The pictures provided by Dr. Obfuscation contained information which contained coordinates which could be read and further integrated into satellite images on Google Earth using Picasa.
The picture below demonstrate the integration of the photos provided by Dr. Obfuscation and Google Earth, which enabled us to tactfully choose which locations to record date from first.
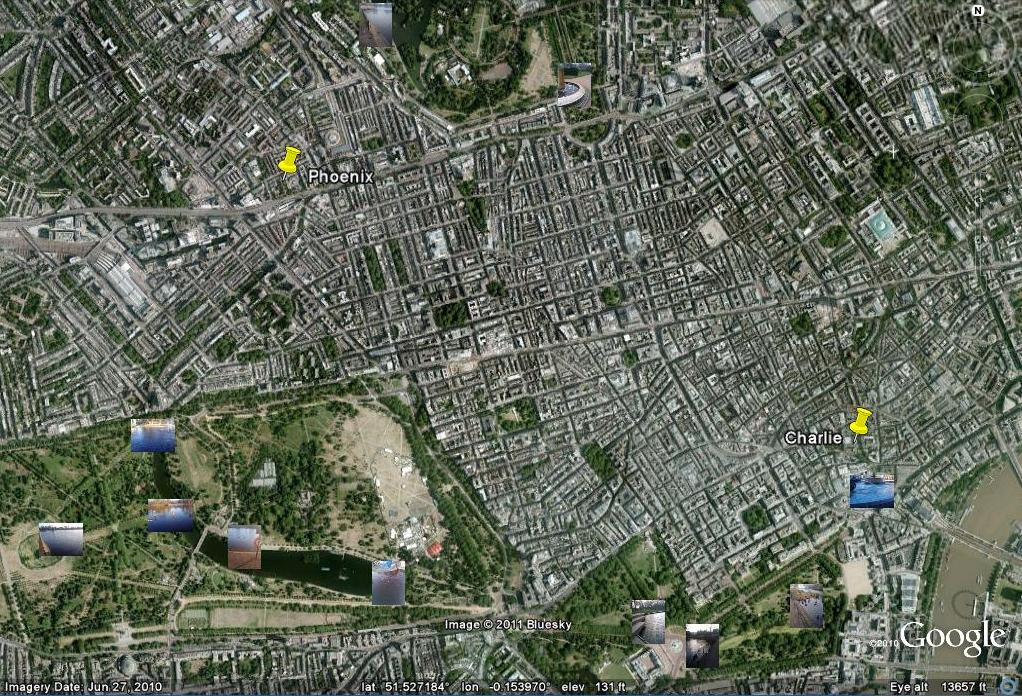
Error Analysis
Latitude, Longitude and Elevation
We checked on the Garmin website, the Etrex Vista C, is accurate within 30 meters and 95% of the time. Its accuracy and errors also largely depends on how many satellites it can find.
Wind Direction using a compass and Tesco plastic bag
It was hard having the compass on a flat surface in some areas as most readings were taken while it was on someone's palm ( a surface that is not even). In addition, regular compasses are not made to point exact North, but relative North which a point with a particularly strong magnetic pull. Therefore many of the objects we identified as being North or South of the water bodies might not have been so, if we were looking for a precise bearings. When experiencing light winds, a Tesco plastic bag might prove to be denser than the wind thus making it impossible to show which direction the wind is moving. Using objects that have a similar density to air, such as dyed smoke or cigarette smoke might be more efficient in showing much lighter winds.
Wind Speed using the Beaufort Scale
The primary error with using the Beaufort scale to measure wind speed is that every humans capacity to estimate the similarity of the effect of wind on an object that is not water (as was originally the case) is that everyone perception is different. When using the plastic bag,a source of era was its density. At times, when the force of wind speed was lesser than the density of the plastic bag, it failed to move this leading to the observatoon that there was no wind when in actual fact there might have been some movement at extremely low speeds. Secondly, when using the water as a means to estimate the wine speed, our method did not account for movement caused by other objects such as animals in the water body or man made objects such as paddle boats. This may have indicated that the wind speed was greater than was the actual case. Lastly with using the trees, a primary source of error was due to the season where most of the leaves haveel fallen out. Similar to the plastic bag, some winds might be too slow to cause movements among the branches of the tree- once again resulting in estimating wind speeds that might be slower than is the actual case.
Air and Water Temperature using the Maplin thermocouple thermometer
Sources of error that we experienced in collecting air and water temperature were both mechanical and human errors. Although we dried the rod after each reading the rod may still have been chilled which may have affected the results of the next air temperature reading. As far as documenting water temperatures we experienced problems with accuracy due to an inability in some locations to immerse the rod without it being in contact with stone. Also the varying depth of the bodies of water may have had some effect on the accuracy of the readings. In the manual of this device it is written that its error is +- 3%.
Images
Left photos are the one that we were given. And the photos that are on the right side are out reproduction of each and single photo. Under every set of photos there is a nice description about what is around. This is the order of them: c, g, h, k, a, b, e, j, f, d, i.
In addition, below is a link that will take you to the premier showing of the Yellow Team's first production (in the form of a slide show) of Holy Pigeon P#$@ Batman, it's Penelope Poison!. Accompanying each picture is a caption including what is North and South of the water body.
Appendix A: Raw Data & Data Analysis
| Location A | Location B | Location C | Location D | Location E | Location F | Location G | Location H | Location I | Location J | Location K | |
|---|---|---|---|---|---|---|---|---|---|---|---|
| Time Stamp | 12:03 | 02:32 | 3:30 | 11:45 | 12:52 | 02:11 | 03:08 | 03:20 | 12:28 | 11:54 | 02:59 |
| Water Temperature1 | 7 | 6 | 5 | 6 | 3 | 3 | 3 | 8 | 4 | 6 | 3 |
| Water Temperature 2 | 8 | 6 | 5 | 7 | 3 | 3 | 4 | 8 | 5 | 6 | 3 |
| Water Temperature 3 | 8 | 6 | 6 | 7 | 3 | 3 | 4 | 8 | 4 | 6 | 3 |
| Ambient Temperature 1 | 6 | 4 | 2 | 7 | 5 | 2 | 2 | 11 | 7 | 7 | 3 |
| Ambient Temperature 2 | 7 | 5 | 3 | 8 | 4 | 3 | 3 | 10 | 9 | 8 | 3 |
| Ambient Temperature 3 | 7 | 4 | 2 | 8 | 5 | 3 | 2 | 9 | 8 | 8 | 3 |
| Location: | Time | GPS Elevation | Air Temp | Water Temp | Wind Direction | Wind Speed | Latitude | Longitude |
|---|---|---|---|---|---|---|---|---|
| H | 11:35 | 59 ft | 8 °C | 7 °C | SE | ~1 | 51.50813° | 000.12798° |
| H | 49 ft | 7 °C | 7 °C | 51.50803° | 000.12762° | |||
| H | 55 ft | 10 °C | 7 °C | 51.50821° | 000.12753° | |||
| H average | 11:35 | 54.3 ft | 8.3 °C | 7.0 °C | SE | ~1 | 51.50812° | 000.12771° |
| D | 12:06 | 31 ft | 11 °C | 5 °C | S | ~1 | 51.50359° | 000.13118° |
| D | 36 ft | 10 °C | 5 °C | 51.50357° | 000.13223° | |||
| D | 49 ft | 5 °C | 5 °C | 51.50371° | 000.13227° | |||
| D average | 12:06 | 38.6 ft | 8.6 °C | 5.0 °C | S | ~1 | 51.50366° | 000.13189° |
| J | 12:25 | 36 ft | 7 °C | 5 °C | S | ~1 | 51.50191° | 000.13934° |
| J | 39 ft | 6 °C | 5 °C | 51.50209° | 000.13946° | |||
| J | 30 ft | 6 °C | 5 °C | 51.50178° | 000.13988° | |||
| J average | 12:25 | 35.0 ft | 6.3 °C | 5.6 °C | S | ~1 | 51.50192° | 000.13956° |
| A | 12:42 | 36 ft | 7 °C | 6 °C | SW | ~1 | 51.50290° | 000.14225° |
| A | 31 ft | 7 °C | 6 °C | 51.50292° | 000.14247° | |||
| A | 30 ft | 7 °C | 6 °C | 51.50288° | 000.14288° | |||
| A average | 12:42 | 32.3 ft | 7.0 °C | 6.0 °C | SW | ~1 | 51.50290° | 000.14253° |
| I | 13:25 | 42 ft | 6 °C | 5 °C | SW | ~1 | 51.50446° | 000.16004° |
| I | 50 ft | 6 °C | 5 °C | 51.50443° | 000.16006° | |||
| I | 45 ft | 6 °C | 5 °C | 51.50443° | 000.16007° | |||
| I average | 13:25 | 45.6 ft | 6.0 °C | 5.0 °C | SW | ~1 | 51.50444° | 000.16005° |
| E | 13:45 | 65 ft | 7 °C | 5 °C | SW | ~1 | 51.50598° | 000.16958° |
| E | 52 ft | 5 °C | 6 °C | 51.50597° | 000.16958° | |||
| E | 55 ft | 6 °C | 5 °C | 51.50597° | 000.16956° | |||
| E average | 13:45 | 57.3 ft | 6.0 °C | 5.3 °C | SW | ~1 | 51.50597° | 000.16957° |
| G | 13:55 | 72 ft | 5 °C | 6 °C | SW | ~1 | 51.50727° | 000.17469° |
| G | 70 ft | 5 °C | 5 °C | 51.50732° | 000.17467° | |||
| G | 70 ft | 6 °C | 6 °C | 51.50729° | 000.17469° | |||
| G average | 13:55 | 70.6 ft | 5.3 °C | 5.6 °C | SW | ~1 | 51.50729° | 000.17468° |
| K | 14:16 | 83 ft | 5 °C | 5 °C | SW | ~1 | 51.51070° | 000.17588° |
| K | 79 ft | 5 °C | 5 °C | 51.51070° | 000.17589° | |||
| K | 79 ft | 5 °C | 5 °C | 51.51067° | 000.17586° | |||
| K average | 14:16 | 80.3 ft | 5.0 °C | 5.0 °C | SW | ~1 | 51.51069° | 000.17588° |
| C | 14:35 | 95 ft | 5 °C | 5 °C | SW | ~1 | 51.50637° | 000.18191° |
| C | 87 ft | 5 °C | 5 °C | 51.50636° | 000.18189° | |||
| C | 90 ft | 6 °C | 5 °C | 51.50636° | 000.18188° | |||
| C average | 14:35 | 90.6 ft | 5.3 °C | 5.0 °C | SW | ~1 | 61.50636° | 000.18189° |
| B | 17:00 | 98 ft | 7 °C | 5 °C | SW | ~1 | 51.52550° | 000.14784° |
| B | 99 ft | 7 °C | 5 °C | 51.52537° | 000.14751° | |||
| B | 98 ft | 7 °C | 5 °C | 51.52538° | 000.14751° | |||
| B average | 17:00 | 98.3 ft | 7.0 °C | 5.0 °C | SW | ~1 | 51.52542° | 000.14762° |
| F | 17:25 | 91 ft | 6 °C | 5 °C | SW | ~1 | 51.52781° | 000.16091° |
| F | 110 ft | 6 °C | 5 °C | 51.52780° | 000.16091° | |||
| F | 98 ft | 6 °C | 5 °C | 51.52779° | 000.16092° | |||
| F average | 17:25 | 99.6 ft | 6.0 °C | 5.0 °C | SW | ~1 | 51.52780° | 000.16091° |
Appendix B: Visualization
Visualization No1.
(Some text here, explaining...)
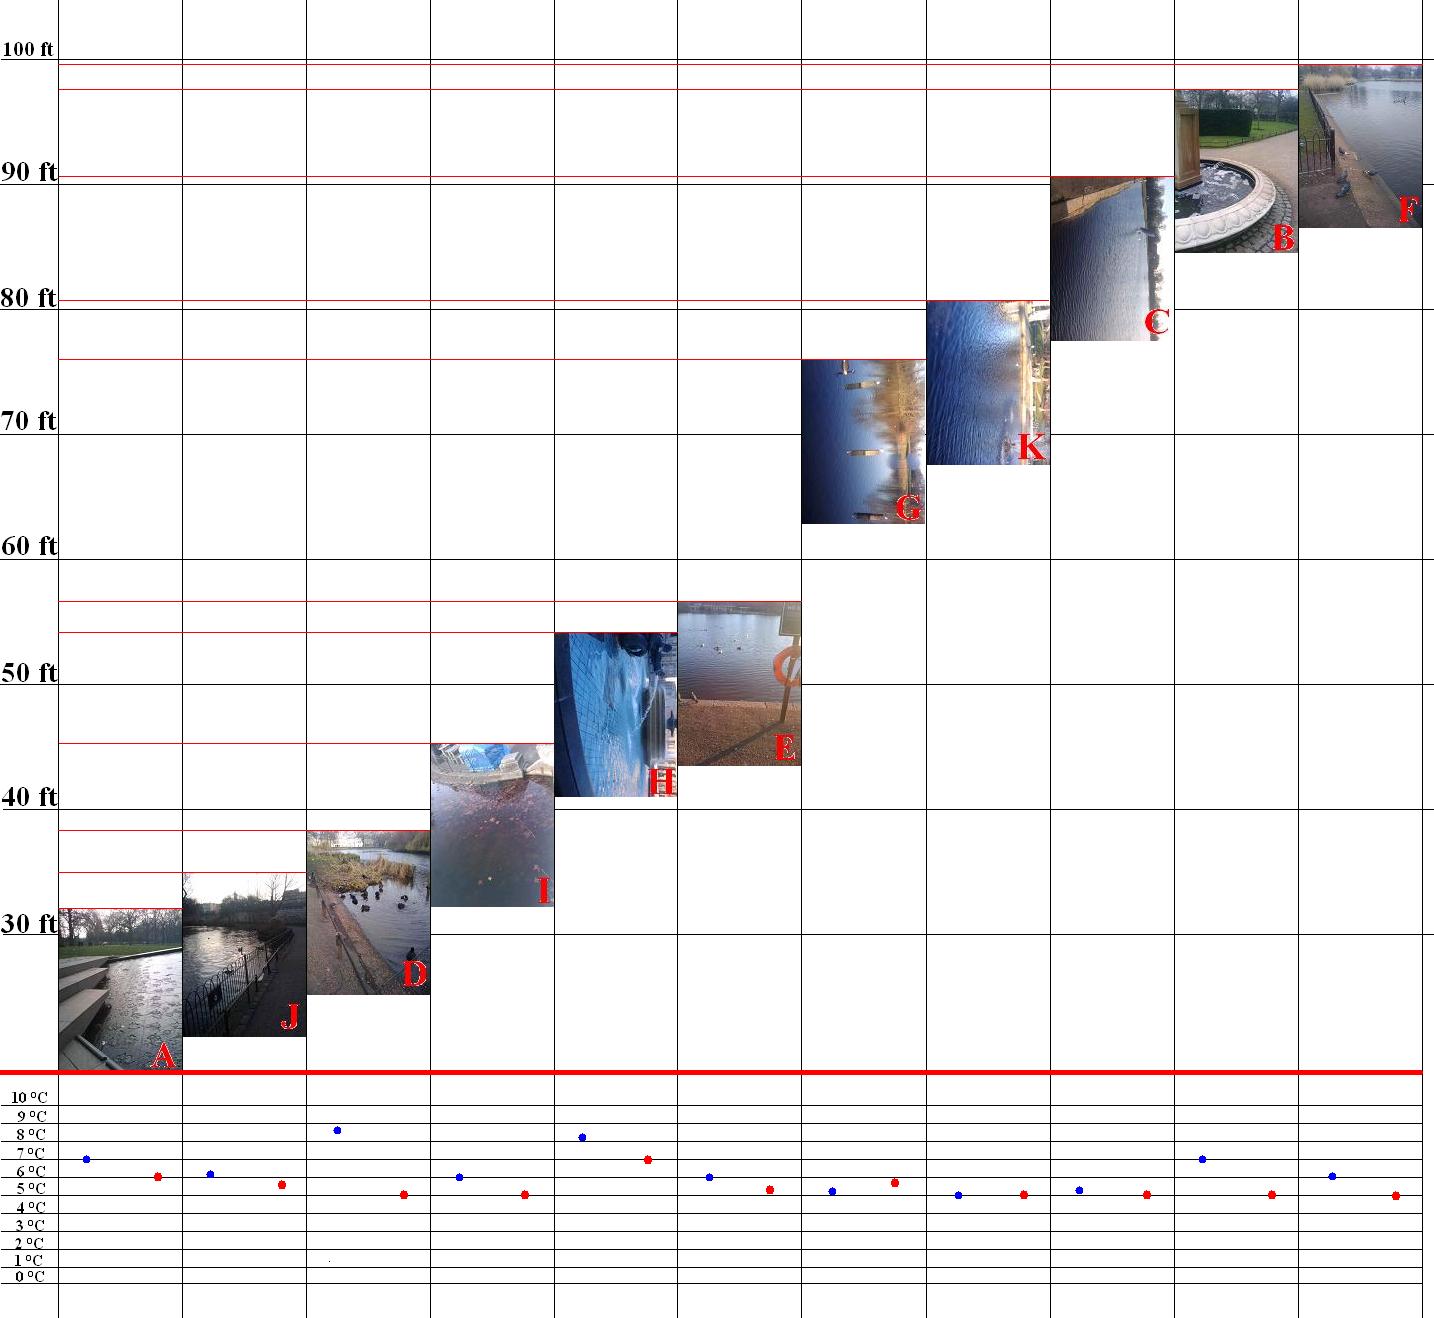
Visualization No2.
(Some text here, explaining...)
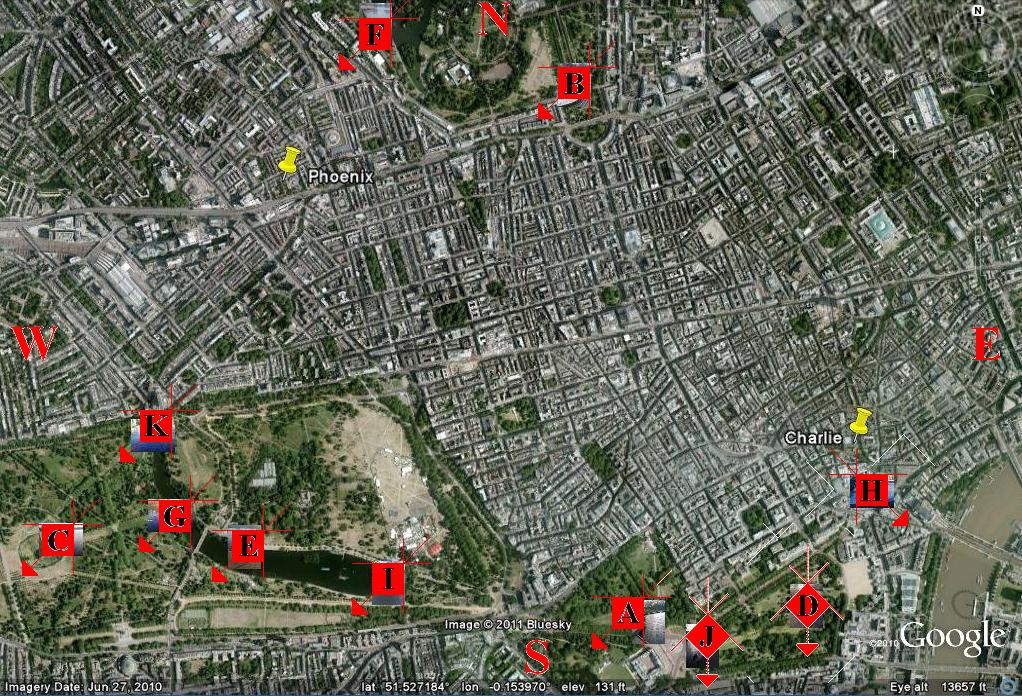
Appendix C: Who Did What
Eva Marengo My contribution to the lab was taking the water and air temperature readings and helping record the data. At each location I took three readings of the water and of the air. In the lab report I did the associated write up. I also assisted at navigation and finding the perspective of the photos taken in order to replicate them.
Vivian Bateyunga My contribution to the lab was collecting data on wind direction using a basic compass and a Tesco plastic bag. I also described what was North and South of the location of the water body. I assisted with copy-editing the lab write up and figuring out the averages for the raw data collected.
Sandra Mamus Ngeseyan I was the principle data-recorder for the group and also helped determine what the wind-speed at each location was. It was extremely important that my handwriting was neat and the recording of data was done in an organized fashion. I helped to write up the description of the lab, as well as gather information from different members of the group.
Ivan Babic I helped with geocoding and determining where are the places exactly and how to get there. I was collecting data of Latitude, Longitude and Elevation. Wiki editing and visualization of data.
England-2011-lab2-green
Green: Krystnell, Johanna, Spencer, McKayla, Gillian
Problem Description and Approach
For this lab, Dr. Obsfucation sent out eleven photographs of various bodies of water around central London. He informed us that Penelope Poison was threatening to release toxic substances at each location; he asked the Green Team to find each location using the photographs and take several readings at each location: longitude, latitude, elevation, wind direction, wind speed, water temperature, and air temperature. More importantly, for every reading it was necessary that we take three readings in order to make an accurate measurement.
Our initial approach dealt with using the geo-coding of each photograph to identify the longitude and latitude and then map out the locations. The photos were downloaded and imported into iPhoto, where the "Places" application created a map of the locations. With a time element involved, we decided to head towards Regents Park first, where two photographs were taken, and make our way back to Trafalgar Square, via Hyde Park and then Green Park / St. James Park. The methodology for the collection of necessary data is explained below.
Data Collection
In order to measure the latitude, longitude, and elevation of each site, we took three separate readings using a yellow Etrex GPS unit. At each location, we turned on the unit, waited for it to locate the satellites, and recorded the first set of readings. Then we moved the GPS unit away from the location and back to cause the GPS to take a new reading from the satellites. We recorded this second set of raw data and then moved the GPS a second time to for a final set of readings.
In order to determine wind direction, three group members took turns using a cigarette lighter at the location to determine the direction of the breeze, faced in that direction, and then took an angle reading using the compass. All three readings were recorded. In order to determine wind speed, different group members used the Beaufort scale to estimate a speed without consulting each other, and recorded their decision.
To determine water temperature, we pointed the Mini Infared Thermometer Fluke-62 at the body of water pictured in each photograph, recorded the temperature reading, and repeated this process two more times to come up with three readings. To determine the temperature of the air, we pointed the infared thermometer at the sky, pressed the button to take a reading, and repeated this two more times to produce three readings.
Data Analysis
| Location A | Location B | Location C | Location D | Location E | Location F | Location G | Location H | Location I | Location J | Location K | |
|---|---|---|---|---|---|---|---|---|---|---|---|
| Longitude | 51° 30.177' | 51° 31.522' | 51° 30.382' | 51° 30.209' | 51° 30.355' | 51° 31.699' | 51° 30.446' | 51° 30.492' | 51° 30.265' | 51° 30.107' | 51° 30.641' |
| Latitude | 0° 8.554' | 0° 8.852' | 0° 10.915' | 0° 7.917' | 0° 10.094' | 0° 9.652' | 0° 10.492' | 0° 7.651' | 0° 9.604' | 0° 8.326' | 0° 10.552' |
| Elevation | 3 m | 35 m | 22.6 m | (-)3.6 m | 14 m | 30 m | 13.6 m | 5.6 m | 14.6 m | 3 m | 16.3 m |
| Wind Direction | 258.3° | 203.3° | 243.3° | 323.3° | 165° | 238.3° | 250° | 48.3° | 286.6° | 32.6° | 223.3° |
| Wind Speed | 2 mph | 3.6 mph | 3 mph | 5.3 mph | 4 mph | 4.6 mph | 2 mph | 2.6 mph | 2.3 mph | 1.6 mph | 2 mph |
| Water Temperature | 43.16°F | 39.16°F | 39.16°F | 39.83°F | 39°F | 38.3°F | 39.83°F | 38.3°F | 39.6°F | 39.83°F | 38.83°F |
| Air Temperature | 32.3°F | 35.16°F | 33.16°F | 32.16°F | 32.6°F | 32.16°F | 34.5°F | 32.83°F | 33.6°F | 31.83°F | 34.6°F |
The air temperatures between our locations did not vary much they were all low temperatures with a range of 31°F-34°F. Due to this Penelope Poison cannot be harmful to the city of London because toxins are usually produced at warm temperatures. Also the water temperatures were mostly low in our locations except Green Park where the temperature was slightly higher than other places. This place has a higher risk of having toxins from Penelope Poison as compared to other locations we have been to. The wind speed in most of the areas that we went to was minimal therefore those areas have a low risk of getting toxins from Penelope Poison. St James Park had a higher wind speed as compared to the other areas we went to therefore the risk of having toxins from Penelope Poison are slightly higher in this place than other areas.
Error Analysis
GPS - The Etrex yellow GPS used to calculate the latitude and longitude of each location may be responsible for several significant sources of error during data collection. We noted that in locations such as Trafalgar square, where there were a number of tall buildings, signal reflection may have caused the information being sent to the receiver to be delayed contributing to further inaccuracy. Although the data obtained in very open locations such as parks were unlikely to be affected by a signal reflection, it is possible that interference with accurate data is attributable to a clock error within the GPS. If the clock inside the GPS was in fact not the same as the clocks of the satellites, this may have resulted in incorrect calculations. However, it was indicated by the system that all values obtained were within the range of +/- 3 metres. At 51 degrees latitude and thirty minutes, the length of one degree latitude is 111,258 metres. This means that the possible error is minimal ( +/- 0.000027 degrees). The length of a degree longitude is 69,440 and again the air is minimal ( +/- 0.000043 degrees).
Wind direction/Compass - We calculated the degree of human error in using the compass as well as a cigarette lighter to be +/- 5 degrees. It is possible that because three different persons were chosen to read the compass, the angle at which it was being held may not have been completely flat, and estimations may have been incorrect based on different strengths in vision. Also, in using a lighter to determine the general direction of the wind we noticed that at several times the direction of the wind changed. We attributed this to that fact that trees other obstructions may have caused the wind to shift its direction and noted it as a significant source of error.
Beaufort Scale - Our reliance on the Beaufort Scale to determine wind speed made our data collection especially sensitive to error. Although there was an intentional lack of discussion among the three group members chosen to use the scale at the different locations, there was a certain homogeneity of results as these members revealed their choices. Furthermore, no matter how basic the descriptions of the scale were, the data became relative to each individuals interpretation of these groupings
Mini Infrared thermometer (fluke-62) - A mini infrared thermometer (fluke-62) was used to calculate the air and water temperature at the various locations. Sources of error were expected to be minimal because of a consistency in measuring the temperature of same spot at each of these locations. It was discovered after data collection that our decision to point the thermometer to the sky to obtain a temperature may have contributed to incorrect readings. It would have been possible to reduce errors associated with this by aiming the thermometer a leaf at the different sites. Despite taking multiple readings and obtaining very similar numbers we note that the margin of error for the thermometer is +/- 4 degrees Celsius.
Images
Location A
Location B
Location C
Location D
Location E
Location F
Location G
Location H
Location I
Location J
Location K
Appendix A: Raw Data
Note: The last reading is the average of all three readings.
Location A
Lat – 51° 30.178’ ; 51° 30.177’ ; 51° 30.177’ ---- 51° 30.177'
Long – 0° 8.553’ ; 0° 8.556’ ; 0° 8.554’ ---- 0° 8.554'
Elv – 2 m ; 3 m ; 4 m ---- 3 m
Wind Direction – 260° ; 255° ; 260° ---- 258.3°
Wind speed – 1 (1 mph) ; 1 (2 mph) ; 1 (3 mph)---- 2 mph
Water Temp – 43°F ; 43°F ; 43.5°F ---- 43.16°F
Air Temp – 32°F ; 32.5°F ; 32.5°F ---- 32.3°F
Location B
Lat – 51° 31.521’ ; 51° 31.522’ ; 51° 31.523’ ---- 51° 31.522'
Long – 0° 8.852’ ; 0° 8.851’ ; 0° 8.852’ ---- 0° 8.852'
Elv – 36 m ; 34m ; 35 m ---- 35 m
Wind Direction – 210° ; 200° ; 200° ---- 203.3°
Wind speed – 2 (5 mph) ; 2 (4 mph) ; 1 (2 mph)---- 3.6 mph
Water Temp – 40°F ; 39°F ; 38.5°F ---- 39.16°F
Air Temp – 38°F ; 35°F ; 32.5°F ---- 35.16°F
Location C
Lat – 51° 30.383’ ; 51° 30.382’ ; 51° 30.382’ ---- 51° 30.382'
Long – 0° 10.914’ ; 0° 10.915’ ; 0° 10.915’ ---- 0° 10.915'
Elv – 22 m ; 22 m ; 24 m ---- 22.6 m
Wind Direction – 240° ; 245° ; 245° ---- 243.3°
Wind speed – 1 (2mph) ; 1 (3 mph) ; 2 (4 mph) ---- 3 mph
Water Temp – 39°F ; 39°F ; 38.5°F ---- 39.16°F
Air Temp – 33°F ; 33°F ; 33.5°F ---- 33.16°F
Location D
Lat – 51° 30.208’ ; 51° 30.208’ ; 51° 30.210’ ---- 51° 30.209'
Long – 0° 7.915’ ; 0° 7.918’ ; 0° 7.917’ ---- 0° 7.917'
Elv – (-)6 m ; (-)3 m ; (-)2 m ---- (-)3.6 m
Wind Direction – 320° ; 330° ; 320° ---- 323.3°
Wind speed – 2 (6 mph) ; 2 (5 mph) ; 2 (5 mph) ---- 5.3 mph
Water Temp – 40°F ; 40°F ; 39.5°F ---- 39.83°F
Air Temp – 32.5°F ; 32°F ; 32°F ---- 32.16°F
Location E
Lat – 51° 30.354’ ; 51° 30.356’ ; 51° 30.354’ ---- 51° 30.355'
Long – 0° 10.091’ ; 0° 10.091’ ; 0° 10.101’ ---- 0° 10.094'
Elv – 13 m ; 16 m ; 13 m ---- 14 m
Wind Direction – 160° ; 170° ; 165° ---- 165°
Wind speed – 2 (4 mph) ; 1 (3 mph) ; 2 (5 mph) ---- 4 mph
Water Temp – 40°F ; 38.5°F ; 38.5°F ---- 39°F
Air Temp – 32.5°F ; 32.5°F ; 33°F ---- 32.6°F
Location F
Lat – 51° 31.669’ ; 51° 31.669’ ; 51° 31.668’ ---- 51° 31.699'
Long – 0° 9.652’ ; 0° 9.652’ ; 0° 9.651’ ---- 0° 9.652'
Elv – 31 m ; 31 m ; 28 m ---- 30 m
Wind Direction – 240° ; 245° ; 230° ---- 238.3°
Wind speed – 2 (5 mph) ; 2 (4 mph) ; 2 (5 mph) ---- 4.6 mph
Water Temp – 38.5°F ; 38.5°F ; 38°F ---- 38.3°F
Air Temp – 32°F ; 32°F ; 32.5°F ---- 32.16°F
Location G
Lat – 51° 30.446’ ; 51° 30.445’ ; 51° 30.446’ ---- 51° 30.446'
Long – 0° 10.492’ ; 0° 10.492’ ; 0° 10.491’ ---- 0° 10.492'
Elv – 13 m ; 14 m ; 14 m ---- 13.6 m
Wind Direction – 260° ; 240° ; 250° ---- 250°
Wind speed – 1 (2 mph) ; 1 (2 mph) ; 1 (2 mph) ---- 2 mph
Water Temp – 39.5°F ; 40°F ; 40°F ---- 39.83°F
Air Temp – 34.5°F ; 34.5°F ; 34.5°F ---- 34.5°F
Location H
Lat – 51° 30.492’ ; 51° 30.492’ ; 51° 30.491’ ---- 51° 30.492'
Long – 0° 7.650’ ; 0° 7.651’ ; 0° 7.651’ ---- 0° 7.651'
Elv – 6 m ; 5 m ; 6 m ---- 5.6 m
Wind Direction – 40° ; 50° ; 55° ---- 48.3°
Wind speed – 1 (3mph) ; 1 (3 mph) ; 1 (2mph) ---- 2.6 mph
Water Temp – 38.5°F ; 38°F ; 38.5°F ---- 38.3°F
Air Temp – 33°F ; 32.5°F ; 33°F ---- 32.83°F
Location I
Lat – 51° 30.265’ ; 51° 30.264’ ; 51° 30.265’ ---- 51° 30.265'
Long – 0° 9.604’ ; 0° 9.604’ ; 0° 9.604’ ---- 0° 9.604'
Elv – 13 m ; 16 m ; 15 m ---- 14.6 m
Wind Direction – 300° ; 280° ; 280° ---- 286.6°
Wind speed – 1 (3 mph) ; 1 (2 mph) ; 1 (2 mph) ---- 2.3 mph
Water Temp – 39.5°F ; 39.5°F ; 40°F ---- 39.6°F
Air Temp – 33.5°F ; 33.5°F ; 34°F ---- 33.6°F
Location J
Lat – 51° 30.108’ ; 51° 30.106’ ; 51° 30.106’ ---- 51° 30.107'
Long – 0° 8.326’ ; 0° 8.326’ ; 0° 8.325’ ---- 0° 8.326'
Elv – 2 m ; 3 m ; 4 m ---- 3 m
Wind Direction – 30° ; 33° ; 35° ---- 32.6°
Wind speed – 1 (2 mph) ; 1 (1 mph) ; 1 (2 mph) ---- 1.6 mph
Water Temp – 40°F ; 40°F ; 39.5°F ---- 39.83°F
Air Temp – 31.5°F ; 32°F ; 32°F ---- 31.83°F
Location K
Lat – 51° 30.643’ ; 51° 30.639’ ; 51° 30.641’ ---- 51° 30.641'
Long – 0° 10.551’ ; 0° 10.551’ ; 0° 10.554’ ---- 0° 10.552'
Elv – 17 m ; 15 m ; 17 m ---- 16.3 m
Wind Direction – 220° ; 220° ; 230° ---- 223.3°
Wind speed – 1 (2 mph) ; 1 (3 mph) ; 1 (1 mph) ---- 2 mph
Water Temp – 39°F ; 38.5°F ; 39°F ---- 38.83°F
Air Temp – 34.5°F ; 35°F ; 34.5°F ---- 34.6°F
Appendix B: Visualization
VISUALIZATION WORK
RANGES:
Elevation (-) 3.6m (to) 35m
Wind Direction 32.6 (to) 323.3
Wind Speed 1.6 (to) 5.3
Water Temperature 38.3 (to) 43.16
Air Temperature 31.83 (to) 35.16
Locations from Low Elevation to High Elevation
1) D - (-) 3.6m
2) J - 3m
3) A - 3m
4) H - 5.6m
5) G - 13.6m
6) E - 14m
7) I - 14.6m
8) K - 16.3 m
9) C - 22.6m
10) F - 30m
11) B - 35m
Wind Direction Values in order of location numbers (in degrees):
323.3, 32.6, 258.3, 48.3, 250, 165, 286.6, 223.3, 243.3, 238.3, 203.3
Wind Speed Values in order of location numbers (in miles per hour):
5.3, 1.6, 2, 2.6, 2, 4, 2.3, 2, 3, 4.6, 3.6
Water Temperature Values in order of location numbers (in degrees Fahrenheit):
39.83, 39.83, 43.16, 38.3, 39.83, 39, 39.6, 38.83, 38.83, 38.3, 39.16
Air Temperature Values in order of location numbers (in degrees Fahrenheit) :
32.16, 31.83, 32.3, 32.83, 34.5, 32.6, 33.6, 34.6, 33.16, 32.16, 35.16
Appendix C: Who Did What
Spencer ~ During the lab I was responsible for recording the data as well as providing one of the three readings for both wind direction and wind speed. Because I downloaded the pictures onto my computer before the lab, and was able to identify the geo-coding with iPhoto, I wrote the "Problem Description and Approach". After McKayla calculated the measurements and entered the raw data onto the wiki, I edited it with the proper notations. I also created the table with all of our measurements and made sure the photographs and visualizations were properly embedded.
Johanna ~ During the lab I used the GPS unit to take readings for latitude, longitude, and elevation, as well as helping determine wind direction with the lighter. I wrote the data collection section of the lab write-up.
McKayla ~ During the lab I took readings for air and water temperatures at each locations. I also was responsible for taking the Green Team's photographs at each location. I created the visualizations for the data on the lab write-up.
Krystnell ~ During the lab I was one of the three members responsible for giving a reading for both wind direction and wind speed. In the lab write-up I took care of the sections concerning the sources of error.
Gillian ~ During the lab I also took the readings of the wind direction and wind speed along with two other people. I also did the second part of the data analysis section.
Journals
These are links to each student's journal for this class. Periodically they are asked to respond to readings, places we visit, specific questions, and the like.
Eva's Journal
Technology and Sustainability Talk I thought that the talk on sustainability was very interesting and remembered a lot of the material from discussions that we had in class. I felt that you did a good job incorporating a large amount of material from various perspectives on climate change into a well-timed presentation. I felt that the presentation was very engaging and despite having heard some of the information before I still enjoyed hearing it again. My only suggestion is more discussion and/or audience participation; I would’ve liked to see more inclusion of the audience other than the limited time for questions that there was at the end. Overall I think it was a well organized, comprehensive, and insightful talk.
'Science at Kew
Kew Gardens are involved with the preservation of seeds in danger of becoming extinct. It is responsible for the Millennium Seed Bank whose goal it is to save plants that meet the requirements to be considered endangered. Their goals are to preserve plants as an important piece in the fabric of our eco system as they provide things such as clean air and water, fuel, food and materials for goods. They also understand plants ties to clime change and the negative effects that a lack of diversity of plant life can have on the environment. To combat this, Kew has set up headquarters around the world working on the preservation of local plants. Evidence of scientific understanding within Kew Gardens was seen in the diverse array of plant and marine life species in the Tropical Extravaganza exhibit, this shows Kews commitment to research and public education about plant diversity. The short-term benefits of Kews work are seen in their substantial work in education by providing a pace where people can come and learn about plants and other living things. The longer-term benefits of the work done at Kew are the sustaining of plant species that otherwise was likely to become extinct.
Reflections on Climate Change
I believe the take away message from the recent weeks lessons on climate change is that global warming and its effectual relationship with human activity (i.e. the burning of fossil fuels) are present and very much real. Knowing these facts it becomes increasingly important, vital really that action must be taken on every level (nations, individuals, etc.) to counter act the effects of global warming. The most effective modality for myself was the play Greenland because I am a visual learner and its marriage of the scene (i.e. the water, the paper, etc.) with the voices of the characters acting out scenes demonstrating the facts and questions surrounding climate change created an easy to understand medium with which to learn about climate change. I think the main difference between the European perspective and the American perspective on global warming is that climate change has already been established as a rarely disputed fact, so the debates that occur here are not about global warming’s existence (as they are in the U.S.) but rather they are about what should be done in regards to it. I think that this difference is really similar to the difference between attitudes on the Earlham campus and the attitudes seen around much of the U.S., at Earlham global warming has been widely accepted and the focus is much more on the solutions rather than its existence that is debated in U.S. politics.
Greenland Review
I found the play Greenland to be educational and full of good information. It was able to cleverly incorporate a vast group of both opinions and approaches to the issue of global worming and our carbon print. From what I could tell the information they gave in the play was all accurate but it was also very much skewed to represent a particular perspective (although it was the one that I myself hold). As we discussed in class, a play was an unfamiliar medium for the presentation of scientific information, which made it, at times, difficult to take seriously (not because the information wasn’t accurate, but because of its dramatization). As something to shape public opinion the play did not do a good job. Although it represented different opinions in a very realistic way and the realities of people that do not believe global warming is a real issue it did so in a way that seemed somewhat divisive rather than bridging, i.e. the parents seeing their daughter as a radical and never agreeing with her and blissfully ignorant. This ignorance would be hard to identify with if this was your real world situation, or rather it wouldn’t be someone you would necessarily want to identify with or that would help you change your opinion.
Atmosphere Questions
Which specific aspects of climate change did the designers of atmosphere choose to focus on?
The designers of the Atmosphere exhibit choose to put a very significant stress on climate change at it relates to global worming.
How well sourced was the science and technology discussed in the kiosks?
The information in the kiosks seemed to be very well informed and at the same time put into digestible formats.
What was the most surprising thing you learned?
I was most surprised by their predictions for the future. I have of course heard of scary predictions of the effects of global worming but to have the information presented in the way that it was both shocking and educational about what actions can, are and should be taken.
Which of the interactive kiosks did you find most engaging? Why? Which of the interactive kiosks did you find least engaging? Why?
I played and interacted with most of the kiosks and found the one which involved the extraction of fossil fuels to be most engaging but I think that that night have been because I liked the game the most. They all did a good job of mixing information and entertaining/interactivity but the space was all so stimulating that it was very difficult for me to force in on any one activity/station.
Sandra's Journal
First question.
The three most significant challenges (in order of importance) I think society faces include utilizing more sustainable energy sources, controlling and eventually eliminating diseases such as HIV/AIDS, cholera, malaria and dengue fever throughout the world and finally modifying devices in order for them to last longer while maintaining peak performance.
In my view the challenge of utilizing more sustainable energy sources arises out of the rapidly growing numbers of middle-class families in newly industrialized countries like China and India. Demographers have pointed out that India’s population could well surpass that of China in the next 30 or so years and what this means is that we can expect more families seeking out the general comforts in life such as televisions, refrigerators, cars and iPods. These are all materials that produce considerable amounts of waste that end up having catastrophic effects on our environment. I do not think this world has enough room for more countries like America, in terms of nonrenewable energy that is consumed and returned to the environment as waste, thus I think it would be very wise of today’s world leaders to actively invest and support research into sustainable energy resources. Much debate has taken place regarding the precarious state of our planet’s nonrenewable resources (oil in particular) and how the status quo benefits the few at the expense of the many in the long-term. However, I think that science has an extremely important role to play in providing this debate with a definite direction. Hazen and Trefil write "Science is one way of knowing about the world (p 4)"and when facing this challenge, I think that science can provide valuable data, not only detailing the negative impacts that humans have had on the planet but some positive impacts as well that can be augmented or modified. An example of what scientific research can bring about is New Zealand's Auckland airport which boasts one of the largest photovoltaic panels in the world, low energy way finding signage and high efficiency chillers for air conditioning. Basically, science with regard to this challenge does not solve the problem by providing a "one-fit-for-all" solution, rather it is a combination of seemingly little solutions that ultimately serve to increase the quality of human existence.
In many sub-Saharan African countries HIV/AIDS still remains a pandemic that affects large chunks of the working-age(21-55) demographic within populations. This in turn has an effect on the productivity of a countries economy who repercussions can be felt by the wealth and education that many of its citizens may have. I think that science provides a realistic solution to the challenge of finding cures and vaccines for diseases that still claim millions of lives today. In our first class we talked about scientific method and how it presented a model of sorts that show how scientists begin to ask the right questions about what they want to find out as how to build and integrate previous research that has been carried out on similar experiments. Given the nature of viruses such as HIV which continues to mutate thus rendering antibiotics ineffective after sometime, science in this case plays a particularly crucial role in that observations made in the past can help with future solutions. While some may argue that cures and vaccines do exist but are being held onto by corporations desperate to make a profit of them, or perhaps the transportation of these vaccines is what hinders much of the populations that need it from receiving it, however I think these two problems are externalities to the precedents set forth by science.
Lastly, I think that working on devices which last longer and still maintain the same levels performance is a challenge that will catch up with the human race within the next 50 years, if it has not begun to do so already. Our social lives are becoming increasingly connected to devices that utilize power i.e laptops, cellphones, iPods, iPads, and Kindles. The more we have devices like these, the more we find ourselves dependent on them- I for one use my Blackberry for everything from texting, to Facebooking to getting directions on Google-maps, and not surprisingly I find myself always seeking out a socket at whatever restaurant I find myself in (something that restaurant managers do not seem to like). While one answer to the challenge of longer lasting devices would be to use them for a shorter time, there are no indicators that this will be a trend quick to catch on in the near future. Thus it is not so much science as it is with technology that one may find one of many solutions to this challenge. If technology can find a way to make one's life easier, I think that it can equally find a way to make it more energy efficient. Although I was old enough to have a pager when those were the "in-thing" to have, I think they were very efficient in that they lasted long and you did what you needed to do- which was communicate with person B in location X. Today, we are literally spoilt for choice with how we choose to communicate and somehow we rarely think "This is the more energy efficient route to communicate therefore I will choose this" and end up becoming part of the never-ending cycle of constantly trashing the old and getting the new when we have overused and exhausted these devices.
ATMOSPHERE I (Monday 7 February 2011)
- Which specific aspects of climate change did the designers of atmosphere choose to focus on?
The overall exhibition focused on climate science and how humans interact within that realm. The designers emphasized a fundamental understanding of how our climate has worked over the years and how it might work in the future. Although I did not manage to try all the interactive models they had, I found the demonstration on how different parts of the Earth experience different climates to be extremely helpful. The exhibition also focused on advancements that have been made in technology that use more sustainable energy sources and have a marginally lesser effect on the Earth’s environment.
* How well sourced was the science and technology discussed in the kiosks?
I would say that the information presented at the various stations throughout the gallery was very well sourced for two main reasons. First, much of the information covered topics that I have learnt about in previous classes and as far as I know it was not contrary to what I read in textbooks or discussed lectures. An example of this was the graph that showed the increase of carbon dioxide in the Earth’s atmosphere over the past 50 years or so, I recognized this from a climate and energy policy class that I took last spring with Thor. Secondly, on the science museum website it was noted that most of the information displayed in the exhibition was received from the Met Office, a “trading fund”(a department established within government using special funds) under the Ministry of Defense. They have state of the art equipment that is funded by the government and have been heralded with the success of the D-Day landings in 1944. In my opinion, that is enough to convince me that the information presented is well-sourced (in the narrow sense of the word-information derived from a reliable, renowned source).
* What was the most surprising thing you learned?
I would not use the word surprising to describe the experience I had at the exhibition, I would use the word “intriguing” instead simply because climate change has been an ongoing topic whose content has been seen across all fields (science and humanities). That being said, there were two things I found intriguing throughout the exhibition simply because I felt like I walked away with some valuable knowledge after seeing/interacting with them which were the demonstration on how different climates in the world are formed and research that is currently going into batteries with renewable power storage. This is mostly because I talked about longer lasting devices in my first journal and think that batteries with renewable power storage present a much better alternative in that we, as humans, would still be able to use the same amount of energy if not more while having a greater positive impact on the environment. However, the slideshow I saw talked about solar energy in batteries being at 29% efficiency at the moment, which is much higher than previous attempts in the past.
* Which of the interactive kiosks did you find most engaging? Why?
The interactive kiosk I found most engaging was one that asked you to be build a model of the environment in order to help explain the various mechanics of how climate can be influenced and what effect it has on land and water. This was very engaging because it was challenging especially after each successive level. Figuring out what to put in the model was not arbitrary and one really needed to consider what was scientists would want to show using that model and what elements would be most important if featured in the model.
Which of the interactive kiosks did you find least engaging? Why?
I found the interactive kiosk about London and how much it contributed to global warming a lot less engaging than other presentation because it presented information that was fairly general in a monotonous slideshow format which came off as extremely passive and unstimulating.
Greenland Review
Greenland- the territory that belongs to Denmark? Not quite. This is the title of a play that was the culmination of four individuals finding a way to communicate the subject of climate change to us- plastic consuming, environment polluting, Blackberry using humans. Before the play began, a handful of quotations were projected on the theatre’s version of curtains made mechanical. I commented to Mckayla and Gillian that statements like that including phrases like “the time is now; it is already happening; population; unsustainable” were wearing thin on my fairly progressive conscience- because everywhere you look that seems to be the message being pummeled into your eardrums. At this point, it is safe to safe I understand the gravity of the situation that mankind is in. Watching this play turned the delivery of this message from pummeling into something more reflective and self-directed, in that I had the choice of which how I chose to understand climate change.
This play was extremely effective because it portrayed the flawed human and our tendency to create and perpetuate a self-fulfilling paradigm, whereby our lifestyles and what we are willing to give up in the name of our beloved environment is nowhere near how much is done to push the message of making a change now because it is already "too late." Although the play begun in a rather eclectic fashion that took a while to get used to, I felt represented both as one of the characters struggling with the question of what to do as well as an audience member watching the show and criticizing their approach to the topic. The set was incredible and masterfully materialized through each scene serving to keep the play lively and entertaining. Their use of the projector to display numbers, graphs, video clips and statistics was a modern twist to theatre I have never experienced before, but nonetheless appreciated greatly. I believe the intention of the writers who wrote this play was to probe at the question of what our role as human beings is in the face of climate change without the unnerving feeling of having a moral at the end of the story with scary figures and statements. In addition, I thought it prompted the audience to critically examine how their role could be affected given factors such as television, technology and growing inequality playing such a tremendous role in how we think about climate change and what ends up being done about it.
ASSIGNMENT DUE FEBRUARY 14, 2011
* What do you believe the take-away message to be?
Based on all the experiences I have had including reading Science Matters, visiting the Science museum, watching Greenland at the National Theatre and walking around Kew Garden, the take-home message to me seems fairly infallible. Know how your world works and then you might start to have an idea as to how to help preserve it and understand why scientists study what they do. A book like Science Matters should be compulsory reading for every freshman in every college around the world because it provides a fundamental and user-friendly glimpse into the world of science. This has been an important foundation for understanding the value of places such as the Science Museum and Kew Gardens because instead of looking at the wealth of objects they have on display for us as aesthetic elements, merely for our pleasure at their novelty, everything from the smallest fossil to the tallest tree serves to increase our knowledge of the Earth, even if one does not feel like it in the moment.
What I believe to be the take-home message is indeed very broad as there are different ways one can know about our Earth as well as different ways of interpreting that knowledge. However, the fundamental element in knowing how our world works comes from the ever-increasing evasiveness of technology and how fast it is (in theory) to gain knowledge on anything from how to build a bomb to how to belly dance. Having gone on the excursions for this course, I firmly believe that knowing about how our world is not about ‘googling’ the greenhouse effect and skimming paragraphs on Wiki- it is about learning something through experiencing it and having it mean something to you.
• Which of the modalities did you find most effective at communicating that message: reading, museum, or theatre? Why?
Quite honestly, I think that a combination of all three has been very effective in sensitizing the importance of being scientifically literate and understanding the implications of climate change. However, if I had to pick one I would lean toward the museum experience as the most effective means of communication because it relies on the individual’s agency in seeking information and knowledge about how our Earth works. Theatre and reading also include some degree of autonomy however one cannot skip to the middle of play because they suddenly become curious about issues addressed at the point, nor can one read a book in a sequence in which new ideas pop into one’s mind. At the museum, I have found that certain facts and concepts were revealed to me in a very calm and unstructured environment making me more receptive to information and less likely to assume that I would not understand it. Sometimes effective communication does not lie within how the information being communicated is packaged i.e. how in a book or in a play, it more dependent on how willing a person is to receive that information and past experience dictates that this is most likely to occur when someone does not feel compelled or coerced into receiving that information.
• What's different about the message here in England than what you hear in your home country about climate change? Different than at Earlham?
In Kenya climate change is not a policy that has a priority as high as increasing MPs allowances. Students usually receive information about climate change in Geography classes early on in their education, however there aren’t separate programmes that emphasize sustainability and environmentally friendly practices. One of the more famous movements led by Nobel Prize winner, Wangari Maathai the Green Belt Movement is one of the only well-known and establishments in Kenya relating to climate change. While Maathai did excellent work in organizing large numbers of women and planting as many trees as they did, they only served to single her out as a political threat and resulted in much harrasment (beatings, arrests and unfair treatment) when raising awareness about climate change and preserving Kenya’s resources. Hearing about climate change is an option that is available to an elite few with enough sense and education to actively seek it out and take it seriously.
I think that the message in England differs from that at Earlham in that the issue of climate change is not treated as a social signifier indicating lifestyle and character. Here everybody is somehow forced to be aware of the implications of climate change because recycling is compulsory and everybody that has a car pay a congestion tax. At Earlham nothing necessarily exists to unify our ideas that identify climate change as a problem affecting all of us requiring a collective effort. Instead you see extreme ends of the spectrum visible in that you have the few who dry their clothes on lines of rope on Barrett’s balcony and recycle almost everything and you have those that not only leave their lights on and laptops plugged in, but never recycle because they consider it a “hippie” thing to do and something that they, and those they identify with would never do.
Ben's Journal
First question:
In your view what are the three most important challenges facing society in the near term (say 50 years)? Why are each of these so important? What does science have to offer for each? What does technology have to offer for each? Your entry should clearly address which are science based and which are technology based. You can describe both science and technology approaches for each of the problems you identify.
- First response.
The three biggest challenges facing society in the next fifty years are climatic change, failed states, and peak oil.
Climate change is a blanket term that covers a wide range of problems from warming and cooling of certain areas to sea level rise. It could cause Indiana to have ocean front property and New York to become the new Venice. This lessens the amount of arable land while simultaneously pushing people into a smaller land area. This will lead to real food shortages and strife as people are pushed together. Sciences offering to this problem are somewhat abstract. They could lead to ways of creating more efficient GMO's (although this hardly seems like a solution), discovering new methods for desalinating water. Technology stands to offer a good deal practical things to the solution. Technology could help help us build better sea walls so our cities can exist what will become below sea level. It could also help us develop machines to desalinate water or land. basically technology creates better systems with our existing science and incorporate new science into both existing and new machines.
Failing states is a huge problem because it creates a breeding ground for terrorist and human rights abuse among other things. Perhaps science can lead through breakthroughs that can help develop cheap infrastructure such as low cost high speed rail systems, but i dont think this is really a problem of science or technology. Likewise, technology could put these places in an area of higher economic stability by developing their resources, but without money this is unlikely to happen. This problem is largely economic and political.
Peak oil may be the biggest problem and one very closely linked to both failing states and climate change. Without oil, a great deal of our infrastructure, whether it be manufacturing or transportation shuts down. Science could offer a lot in terms of new fuels or new higher efficiency methods of extracting heat and in turn energy. Technology will allow us to adopt these new methods and adapt our current infrastructure to their use.
Atmosphere I
I found the exhibit Atmosphere interest, less because of of what it told about climate chance. Instead i was interested in how they were relaying that information, particularly how they linked technology (the interactive displays) with real artifacts (the ice core). The information about climate change was alright, but after several classes on the topic it was nothing new. Here is my critique of the displays:
- The hydrogen car: I wish it demonstrated more about the technology, but even without developing a complex understanding it was neat to see a prototype of this much talked about but as of yet undeployed technology.
- Several of the stations involved simulation games. I thought these were a neat way to engage people in thinking about what really influences climate change. I was a bit frustrated with the inability to tell how much emitted by section (do cows farting and transportation have the same effect on the atmosphere?). Even with their flaws, this was a step in the right direction when it comes to interactive displays.
- Several of the displays did not tend to work very well. This included several that utilized cameras to recognize movements (the one as you first went in on the left). Several of the touch screens were also a bit touchy.
- Each display was repeated several times. This was helpful especially when there were several people where in the gallery simultaneously.
- There was a lot of overlap between displays. This allowed ideas to really sink in by presenting them in several different context. It also gave the issue a breadth of coverage that is often lacking.
Overall it was a good exhibit and one that i learned a lot from. Granted most of what i learned is not directly relevant to climate change, but relates more to our ongoing project to monitor energy consumption (which arguably is tangentially related to climate change...).
Final notes: the information seemed pretty well sourced. They quoted a number of people who seemed to be well known in their field. The thing that led the most credence to the exhibit was my prior knowledge in the field. I had heard it all before, in some form or another, so either all the material was sourced poorly, it it was all pretty decent.
Greenland Review
The play was pretty interesting and the information contained in it followed what i have learned in my various classes and readings. The whole scene around COP15 was particularly interested to see acted out. I have a pretty good background on the convention because of a class devoted to it, so they information was not new, but the media was.
Overall, the play presented some good information, but i had trouble getting a take away message of what is happening with global warming. While this is frustrating, it is also how i feel about the global warming scene more generally, so in this respect it is very accurate. This frustration does clearly show the way i see global warming viewed on a high level, and it does present a lot about the types of activism (including the problems) that are taking place, it is not that convincing. Perhaps this is because it is not meant to be, it is only an informational piece. It also did not inspire action, there was no take away message, no good do this. This made the play more interesting, but it also made it a less effective motivator. Perhaps i have just seen too much on this topic and am less susceptible to it...
Reflections on Climate Change: Less backwards does not equal forward
I cannot say I learned an extensive amount about the science of climate change. I have had many classes and done a lot of reading on the subject so most of what we have seen is merely review. There were probably a few things that tied together a few of the other pieces of information, but this was fairly minor. What i have learned about is ways of relaying information. In the past i have gained most of my information by reading, which i still think is one of the best ways of gaining what i would call primary knowledge. The play, and to a lesser extent the museum provided the secondary knowledge that tied it together. Its interactive and socially engaging format was very effecting and bringing up some questions and synthesizing information. Simply talking with other people, whether they are very knowledgeable about the field is another, perhaps tertiary way of gathering synthesizing information. The play certainly promoted some discussion, which was very nice.
There seems to be much less skepticism about global warming here than in the states. In England the issue is less political, and the government seems to have reached more of a consensus about it being a problem. For instance, in our visit to Kew Botanical Gardens there was information about climate change as it relates to different flowers, even going as far as to advise which plants should be grown in a changing climate. In the states we are still arguing over the role of god in the issue... I am not saying there are not skeptics here, but it does seem more socially accepted and less controversial, although i do not believe there is consensus on a solution yet.
Much like the states and Earlham, the English do not seem particularly inclined to do a whole lot about climate change. While there is relative agreement about it being a problem, there is still a divide about about any real steps being taken to change the direction we are heading. At Earlham, we like to think we are doing more than the English, but as far as i can tell, we are not. In the US more generally we are still trying to figure out which "80 year climate patterns" is causing hurricane Katrina, or why we are heading the same direction as the arab world (sand anyone? remember it used to be the cultural capital of the world...) in our slow descent into hell. Obviously, these questions are all encompassing and do not leave a lot of room for frivolous questions like "what can we do to slow this problem?" or "Does Jesus really approve of my HYBRID Tahoe that i carry my groceries home from the supermarket in?" because obviously these are not related questions.
Finally, a take away message: The science is solid for global warming, nothing else is. People do not understand the solutions or even the necessity for them. We are probably more backwards in america, but then we your operating on this high of a level the difference between 39,000 feet and 11,800 meters is really not that significant.
Science at Kew
These thoughts roughly follow the posed questions, although the format is somewhat loose.
- I really enjoyed the visit to Kew Gardens, but i must admit i spent much of my time wandering around enjoying the day and surroundings. That being said, i guess i will mostly guess about the science as i did not have time to pursue that information as maybe i should have. According to some signs i saw posted, Kew is doing some research into the way climate change affects plant behavior and their abilities to survive in certain habitats. They even had a plaque suggesting people grow plants that will survive in hotter climates with less water.
- After glancing briefly at Kews website, it seems that they run a multinational seed bank. I know of several other such organizations, but i am not sure of the scope of Kews, other than that it has a presence on every major continent worth collecting seeds from (I am not sure how much Antarctica has to offer). I am assuming that this seed bank is stored somewhere, but they also have a remarkable amount of living plant matter stored in their greenhouses.
- According what was in some lecture or somehow conveyed from Charlie, Kew does a lot of work sequencing genes. I did not really see a lot of information on this.
- Apparently they are doing a little bit of research on compost and its uses / management. After all, they had one of the biggest piles in the UK.
- With the exception of a little info signage about global warming, i did not see many that pertained to the science being done at Kew. Granted, i did not read a lot of signs and most of them that i did see noted how such and such a person had such and such a building created for such and such a ceremony.
- A lot of the work Kew does, i would qualify as outreach. It is not new science per se, but it is not always readily available to the public. Through the programs that Kew runs, this knowledge becomes more accessible to those who can afford to go. They provide walks and their signage as an educational forum for those who might not otherwise get the chance to learn about horticulture.
- Simply by having their garden available for people to attend, Kew is providing a service. It allows people a chance to get out and enjoy a bit of the less built environment and appreciate and hopefully become interested in horticulture.
Fibonacci at kew
I had a little trouble finding a lot of Fibonacci sequences at Kew, but i found a few.
- Pine cones - obviously used as an example
- I am curious whether pine trees fall into the same category (one branch at the top, then an increasing, possibly fibonacci sequence, as they go down. this is probably a rather rough model.
- I have done some research and found out how the Fibonacci sequence relates to the way leaves spiral, and how plants grow. Unfortunately i do not understand how this works and did not see it at kew...
Technology and Sustainability Talk
- Charlie Peck presentation: sustainable energy, technology. 2/16/11
- Technology does not depend on science... true but i had never thought about it before.
- "well how did we get here?": tell what Buoys are... satelites are obvious as are navies, but most people are not familiar with buoys.
- good explaination of the grid
- watch / define usage of somewhat technical terms like "load"
- Talk about how much energy this would save. power production matches peak demand, if you reduce peak demand then you dont have to build as many powerplants etc.
- London Farmers markets: http://www.lfm.org.uk/ - heres how to find farmers markets in London
- Dynamic routing sounds very cool
- Hydro electric - not all that sustainable... raises water levels, more evaporation, problems for fresh water.
- What about identifying some common threads at the begining or end?
- steel vs wood buildings: Great example, very interesting
- about 8-12 minutes too long... cut some time out of the "so how did we get here slide"
Astronomy and the Cosmos
- I am a bit confused about the difference between fission and fusion, and how we use these technologies relates to how they occur when starts are formed.
- So there is no water on mars? If my memories holds, i thought one of the mars rovers found ice?
- what is the difference between Dark Matter and Dark Energy?
- is it likely that the elements we know are possible, but have never found, are out in one of the galaxies?
Krystnell's Journal
First question.
It’s hard to imagine that fifty years ago, the biggest challenges that society faced were centered around issues such as extraterrestrial life and finding more efficient ways to communicate. We seem almost light years away from the idea of UFO’s and pagers and with the emergence of satellites and cell phones that can fit directly in your ear, the scientific and technological “problems we once had seem trivial. This forces one to question whether or not waste disposal, clean water, and replacement body parts will also one day be seen as trivial, instead of as the most important issues society faces today. All one has to do is walk through any neighborhood after Christmas Day to fully grasp why it is imperative that a solution be found for disposing of waste. The amount of cardboard, Styrofoam and other non bio-degradable products that have to be collected and thrown into a landfill somewhere has begun to pose a huge threat not only to the environment, but also to the way we utilize the shrinking supply of land that we have left. If scientists could somehow discover or create more materials that are bio- degradable then we could at least have garbage that is broken down at the same or a faster rate than it is being built up. Although advancing technology has provided us with products that are smaller and hence take up less space when they are thrown out, more can be done to make these products more easily compressed. If there was technology available that could take a car and compress it into something the size of a lima bean, then we might be able to put off the effects of over-flowing land fills for at least a few years! The situation that Haiti has found itself in concerning cholera is a direct effect of not being able to supply some of it’s citizens with clean water. Scientifically speaking, there are several ways of purifying water. However, these ways usually take a lot of technology and tend to be costly. If scientists could somehow figure out how to clean large bodies of water using cheap and easy to obtain chemicals. Then, technology could figure out a way to detect bacteria and other harmful organisms that might find there way into them and destroy them quickly. Being able to replace body parts is one problem that comes with a lot of social implications however, the benefits of such a scientific advancement would far out way that moral discrepancies that may arise. Firstly, the quality of lives would be improved and the mortality rate would take a significant plunge. The role of science in this would be to find an efficient way to harvest and supply organs that worked just as well as those that are formed naturally. Technology would bare the responsibility of making sure these organs could be properly stored and distributed around the world. The may concept seem extremely futuristic and in some ways too ‘artificial’ but the fact is that advancing science should aim to make life on earth not only sustainable but easy. Science and technology have found themselves inexplicably linked in our society today. It is a pseudo-partnership that should always run in tandem with each other to provide advancements that serve humanity and the environment.
Second question
One cannot help but be sucked in by the soft blue light that radiates from the atmosphere gallery in the Victoria and Albert Science Museum. The exhibits which focus mostly on climate science, make it pretty easy for just about anyone to become engaged with the issues and history of the world’s changing climate. In particular, I found the kiosk about different climates of the world to be informative. Although I have a basic idea of what climate is, I admittedly was not completely aware of how the changing climate was affecting different areas. This kiosk (Climate systems) allowed me to pinpoint areas of the world that I might not ever be able to visit and in a way ‘experience’ by visual aid, the climate of that region. Even more engaging was the option to see how a changing climate would affect those areas in the future. The kiosk that I did not find enjoyable was the kiosk that talked mainly about the United Kingdom’s plans for reducing carbon emissions. It merely stated that emissions would be reduced by 80% by 2050 but did not go into great detail about exactly how the government planned to do all of this. It was also the least interactive of all the kiosks in the gallery. I most enjoyed the non- interactive displays like the tree bark with the growth rings and the ice core. I was unaware that ice cores could also supply information about how much carbon is being emitted during different time periods. It was without a doubt the most surprising thing that I learned. These non interactive displays were basically exactly what I thought I’d find in a science museum. For me, they represented cold hard undeniable science that I could see and hypothetically touch. The source of the information seemed to be mostly textbooks, which I thought was quite interesting. There are a lot of theories associated with climate and climate change and it was a relief to see that the gallery focused mostly on providing information that was factual. It made the entire experience comparable to a really ‘cool’ virtual classroom.
Greenland Review
It’s the supermarket scene that really gets the feeling of guilt rolling in. As the actress suspended in the air shouts down at the shoppers about the amount of plastic that we use to wrap everything in, one begins to realize that dealing with the issue of global warming is a lot more within grasp than one would think. However, I got the sense that the aim in creating the play ‘Greenland’ goes beyond making the audience feel guilty about buying flowers wrapped in clear plastic. The show provided a strong sense of awareness and did well to inform listeners of exactly what the ‘situation’ is. It was quite impressive to see just how easily the actors portrayed the roles of persons with different levels of interest in protecting the environment. Most people are unaware that global warming is far more than a scientific issue and has managed to reach the forefront of the political arena. The story line of the play, despite being disjointed, was easy to follow once the actors got further into their roles. What is at first confusing becomes all of a sudden clear once one understands that the play is about the way different persons within society are linked by one common goal. There was the young girl who left her college ambitions behind to join protesters and the secretary who worked in the UN, these characters were going about affecting change but in vastly differing ways. I was impressed by the way the stage set up and lighting was used to keep the audience engaged in what seems to be an issue we hear about in some way all the time. The lighting, the music, the elements of ‘rain’ and ‘snow’ made the show not only visually appealing but quite simply stated, cool. I especially appreciated the monologue about using toilet paper. It was a clever way of bringing a serious issue like wasting to an audience without ‘preaching’. One aspect of the play that I felt could use clarification was the entry of the polar bear on the stage. Polar bears face one of the biggest threats to their habitat because of the melting ice. However, those far removed from the scientific world may not have understood the inclusion of this in the play. “Greenland’ is a play that can appeal to those who are aware of the issues associated with global warming as well as those looking to be informed. The fact is, no one can walk away from this production without a newly found sense of responsibility as a global citizen.
Reflection on Climate Change
As a science major, I have the privilege of being quite aware of the threat that global warming poses to our planet. Needless to say, I am always hoping to learn more. Having this subject presented to me in so many ways this semester has told me a lot about myself. The kiosks at the museum were well done and of course very enlightening but were probably the least effective in holding my attention. The reading exercise was easy to follow and definitely appealed to me more than the museum gallery. It could be that I prefer reading my material to feeling as if I’m playing a video game. The theatre performance was without a doubt my favourite mode of learning. In fact, I now think that all my classes should be taught as plays. It was intriguing to see scientific matters presented in such an entertaining way. The difference between the message that is delivered in London versus that which is delivered in the United States is simple. In London , the message appears to be to reflect the idea that, “each person should take responsibility for their own actions” whereas in the United States, the message more or less reflects that saving the planet has to be a group effort. Also, the way in which the message is delivered is different. In London there is much less ‘fashion oriented’ environmental awareness whereas in the States there seems to be a whole pseudo culture surrounding it.
Review Of Sustainability Lecture
The image of mirrors surrounding earth is the first thing that comes to my mind when I think about last Wednesday’s sustainability lecture. The information presented was not only current and informative but it helped me to understand exactly how much thought and care scientists are putting into the issue of global warming. I was surprised to realize that a bulk of what was presented dealt with ideas that I had never heard of. For instance, the fact that we could move into an age where instead of throwing ‘whole machines’ away we could simply deconstruct parts and reassemble them into a new machines, was an idea that had never crossed my mind. The lecture also brought up the issue of living in the city versus living in the country. The myth that city dwellers are the main cause of environmental degradation has been completely dispelled from my mind because it completely makes sense that they are not. They do indeed travel shorter distances and they usually share the transportation that they utilize which is far better than the way of life those living in less inhabited areas are accustomed to. I was also surprised by the fact that if more persons decided to move to one area, then disaster control could be vastly improved. If nothing else, the presentation revealed just how important it is for different areas of science to collaborate in combating the issue of sustainability. There is no single branch of science that can come up with a solution. In fact, I now realize even more how important public education on this subject is.
Spencer's Journal
FIRST QUESTION
Tensions dealing with race
Unfortunately, technology, in the broadest terms, has made previous attempts at solving this issue. I am referring to a social/city engineering, whether it be the Jewish ghetto’s from the Holocaust or the contemporary gentrification of modern cities. However, most of these have had tremendous reverse effects and polarize the problem. I believe one solution could hinge on science and tracing individuals genes and heritage. George Schuyler wrote a fiction novel Black No More. It explores the hypothetical situation of scientific formula wherein a black person may change the color of their skin and pass as white. Obviously, the novel is a satire, but what I find prevalent in a realistic solution is a prefatory quote that speaks to the notion that, in America in the 1920s, it would be unrealistic to find a person completely white or completely black. I think science and the concise study of human genomes could present actual evidence showing that any ‘pure race’ is a false idol. From a humanities perspective, racism, xenophobia, etc. is a huge roadblock to our current limitations of science and technology. As we addressed in class, we have the science to currently solve a lot of the world’s problems but for one reason or another choose against implementing them. Now, this may not solve the problem to do with capitalism, but it is my belief there is still and underlying issue of racism, wherein first world nations like the United States look negatively at the third world nations be it Africa, South America, or the Caribbean. You may think this is a bit of a leap, but a friend recently told me an anecdote he learned in a science course at the University of St. Andrews. There used to be a huge problem with mosquitoes in Georgia, Alabama, and the Carolinas. They used a spray, forgive me for not remembering the exact name, that was extremely effective in killing off mass amounts of mosquitoes and decreasing the problem drastically. However, there were chemicals involved that could be harmful for the human population. Once the problem was taken care of in the United States the product was then banned worldwide. I believe it is more than just coincidence that it was made sure the problem be taken care of in the States, without affording a place like Africa the same opportunity, and today we see the continent still struggling with the spread of disease through a massive mosquito population.
Accessibility of drinkable water
This is a major problem in the world today that is only highlighted by the recent debacle with the aftermath of the earthquake in Haiti. Although technology may be able to help prevent some of the destructiveness of natural disasters, I am less optimistic of human being able to completely prevent said disasters altogether. As a result, I think there will always be the likelihood of such disasters causing large disruptions to nation/community’s, especially those still classified as ‘developing’, infrastructure. When this occurs one of the first problems that needs to be accounted for is the distribution of clean, drinkable water; next to Oxygen it is the most fundamental factor of human survival. This is an issue that can be attacked through the interplay of science AND technology. For one, science can continue to research the best and most efficient means of water purification. This may likely be the tablet method or some other way, but whatever method it is then technology that needs to be utilized to find appropriate means in which to implement said device. Obviously, one cannot go around to every home every morning and drop tablets into each pot of water, there has to be a better way, and that is where engineers come in. Engineers can also use technology, in a cooperative effort with geoscientists, to find better and more efficient means of harvesting natural fresh water. This would most likely start with the development of more efficient and reliable well systems, something that can quickly be introduced to areas that have recently suffered a dramatic natural disaster. Although my knowledge is limited, I know this is a current focus of programs like Engineers Without Boarders in less developed areas of South America and Africa.
Technology itself
Sometimes I feel like with every problem we solve with technology we are simply creating ten more. For instance, through computers and all the associated growing technology we are solving millions of issues dealing with communication, education, and time. However, my personal belief is that it is propagating a generation that is glued to the screen. This then creates problems with people’s eyesight, their social skills, and most importantly, obesity. Altogether it polarizes this new generations interests in a shift from the natural world surrounding us First off, the scientific method needs to be utilized in order to find some accurate reading on just how much of an effect all of this computer/television/entertainment/educational technology is having on today’s population. There are a number of things to be measured: overall health, social skills, and an appreciation for the natural world. I bring all this up because I think science, specifically the scientific method, could lead to some interesting findings. Unfortunately, I don’t think this issue is one that should be solved with more technology. Instead, based on the findings there should be some sort of education process wherein one is correctly taught how to balance the use of new technology with use of our natural surroundings.
ATMOSPHERE
I found the Atmosphere quite an amazing tool for learning some of the more intricate details of how and why our atmosphere operates the way it does. The interactive qualities were quite thorough in ‘tricking’ kids into learning. Obviously, a full experience would entail reading many of the displays, but one could even do without if they made use of the interactive kiosks for they did a magnificent job of showing the step-by-step process the atmosphere undergoes, whether it be the mechanism greenhouse gases provide or the complicated intricacies that create wind patterns and climate zones. Overall, I most enjoyed the game involved with Greenhouse gases. I think it did a wonderful job displaying how vital a role the appropriate level of greenhouse gases in sustaining a livable temperature on Earth. Not only did it show and explain this in steps, it put the person at the kiosk in control of it. Unfortunately, the kiosks I found least engaging is a more complicated matter. I believe this is because I moved on quickly from those kiosks. One kiosk I did find a bit boring and less accessible to anyone with ADD was the display where you could choose various people from around the world, in various professions. You then get to see how temperature changes would affect their life. This kiosk had way to many options at each point where a choice was needed. If you happened to click the right one, the screen moved to quickly for you to read the information they provided. I was not a fan of this display. Overall, the science this exhibit taught was the same information the public schools in Columbia, MO took four years to teach. I would say it was pretty effective and is an amazing tool for the youth.
GREENLAND REVIEW
If Greenland had been just a spurting of facts, I would have fallen asleep after the first ten minutes. If it had been just a long presentation full of scientific jargon, I would have spaced out and lost all attention. If it had been just a sequence of graphs and displays charting climate change, I would have grabbed a few glasses of wine and gotten tipsy. It was not; it was much more, and the beautiful aspect to the performance is that it addressed human nature and its involvement in our appreciating the problem at hand, something even the most un-scientific of us can recognize.
Some may find the play a bit disjointed, or scattered. There are several “storylines” occurring simultaneously, and theatrically it can definitely get a bit confusing. I, personally, enjoyed this characteristic of the play. It reflects the issue in that there really is not one single story to climate change. There are several stories that have led and continue to lead to the problem this world is facing, some scientific, some political, and some an issue of human tendencies. I feel each storyline added a different perspective and unique approach that in today’s polarized media often goes unaddressed.
It was a small role in the play, but I very much enjoyed the segments with the actor, who opened the play, at stage front. He opened with an anecdote about the psychology in following the crowed. I had heard this before, but feel it was perfectly placed in the context of debate over climate change. The media and one’s family can play such a large role in what we choose to believe. It is like the girl from the “This American Life” segment. She heard in enough places and that view, that global warming is propaganda, is what got implanted in her head. People need to start thoroughly exploring the issues themselves and not allow themselves to be manipulated by biased media. I also enjoyed his bit involving “Deal or No Deal”. Like the anecdote about smoke, I thought it did an excellent job of addressing people’s often lackadaisical approach to environmentalism through more of a metaphor that really reaches everyone.
At first, I was not a fan of the parts involving the two women in relationship counseling. It did not really speak to me all that much. Upon further reflection, however, I am able to pull something useful from these scenes. The dramatic staging of their conflict, with them getting further apart on stage every time, highlights the difficulty we can have when attempting to force change upon someone. Again, it is very similar to the segment, “Climates Change, People Don’t” and offers a respectful stance to those that find it hard to accept the science on climate change.
I believe much of the focus was put into the scenes involving the geoscientist and the political aid to Cameron. After viewing the play I was most impressed with these segments and they highlighted how much of our future and ways we address climate change actually comes down to the same old saying, “It’s all just politics”. For me, that is a scary revelation. I’m not sure the play set out to provide a strict stance on what the political solution would be, but more an awareness of just how complicated it can get. They basically criticized a pretty liberal stance (Obama coming out too early and declaring an agreement had been reach) and the dissenting opinion of developing countries. Personally, this did not leave me feeling all that positive and has me worried about how much of a mess has become. On another note, the role of the geoscientist was excellent in taking some of the pressure off of scientists and allocating it to the rest of us. Hopefully, it made the audience recognize that it is not realistic for us to place all of our faith in scientists to figure this out and fix it. It is too daunting a task for them to dedicate their entire lives to such a cause, I’m sure, however, there are plenty that do, and that the everyday citizen of the world needs to take up a bit of the responsibility.
The other two main storylines I am still unsure of. The girl striving to be an activist obviously has some sort of message about the growing concern within our younger generation. It made some of those concerns seem almost immature. The credibility of the boyfriend was definitely removed with his cheating, and the organizations and protest did not appear all that organized or structured. I am not sure how I feel about this afterwards. I do like the overall storyline of the girl, that she herself persists in her drive and passion, but that it takes some up and downs for her to really figure out what that drive is.
Then there is the kid applying to Cambridge / communicating with his future self (at least that is how I have decided to see it playing out). From a drama perspective I thought this was the most beautiful and creative storyline, but I am not sure of its greater message. I would be very interested to hear if anyone else got something more out it and if so, what.
I have to raise my hands and applaud the performance. I think it did something new and unique. It proved theatre a medium that can reach an audience and force them to reflect on their views of climate change. I do not think its main goal was to force us to believe the science, but simply to reflect. It definitely got me too.
REFLECTIONS ON CLIMATE CHANGE
Personally, after all that we have been privy to the last several weeks, my take-away is that all the scientific speculation of the future is irrelevant. Maybe this is just because I do not have any problem agreeing with it in the first place, but after the Greenland experience I do not think the actual science has to take front stage anymore. As we have been told, science, after a lot of years struggling for consensus, finally is at a point when a pretty vast majority of the community can agree on global warming. Spitting that information to the public is not going to change the opinions of Fox shock-jocks or most of the general public that is already unwilling to agree.
Atmosphere was great in teaching some of the basic science that goes into the greater science of climate change. Certain information there cannot be ignored, like the necessity of greenhouse gases or the awesomeness of geoscience and research (the various ways they can uncover the past are pretty radical). However, I do not know how much that information is going to force someone to reflect on their lifestyle and make some of the changes that are necessary for society.
This is why I am so intrigued by using theatre as a medium. First off, it is a medium that is respected by people of all demographics and sides of the climate change argument. Someone totally opposed to the science of climate change may still be interested in attending a play like Greenland because of his or her great admiration of theatre (the only negative is that outside of communities like London and New York this is going to be much less prevalent). Furthermore, I do not think they would be put off by the experience because it is a very professional piece of work, and in the end it is not really forcing views on its audience but asking them to reflect. The more the general public spends “reflecting”, the closer, I think, we will get to making the necessary changes in our lives that will serve beneficial to all of us.
In America, I do not see many people approaching the problem with this regard. What you always hear is the debate of the science. As I mentioned, scientists are basically at a consensus, so most of the “debating” is coming from the unqualified likes of Bill O’Reily, Rush Limbaugh, etc. It is extremely sad because, to some degree, these are the most influential voices, not the scientists that are in consensus. Furthermore, this sort of media does not care at all about its audience reflecting, they present the issue as though it is cut-and-dry simple (their stance often being that is of no concern). I am not optimistic that the presentation of the actual science will ever be enough to counteract the effect these voices are having, and so the best solution is discovering some sort of medium, I think it needs to be some sort of creative artistic display be it theatre, cinema, music, visual art, that can really lead to reflection.
TECHNOLOGY AND SUSTAINABILITY TALK
I think Charlie’s Technology and Sustainability lecture went very well. My only complaint is that the audience consisted solely of Earlham students and a few FIE faculty. Much of what was discussed has been presented to us already throughout the semester. I wish more had attended because I think anyone and everyone could have benefited from it. The presentation was very well structured and easy to follow, the displays (with the crafty cutting back and forth from the slide to prevalent images) were very useful. Nothing was all that complicated; the jargon was kept fairly simple and time was taken to fully explain the ideas presented so that even a fourth-grader would have understood them.
The part that seemed most exciting to me was the resolutions you presented. I was extremely interested by the bit about the electrical grid. I, too, was in the midst of the great blackout of the Northeast (we were in Ontario, unfortunately Canada inaccurately got most of the blame at first). It seems like an incredibly daunting task to redo the grid, as you pointed out, but that there are feasible ways to improve it with microgrids, etc. I would be interested in looking further into this solution as it something I had never heard previously discussed in the media.
Something you have spoken on before in class that is always interesting is the difference in living in a city from living, say, on a farm. It is very challenging for me to believe that living in a city leaves less of a carbon footprint than living in the suburbs or out in the country. I get the argument of transportation and such, but visually it is just so hard to believe when I see all the industry and pollution that a city produces. The explanation becomes a little more clear when one considers it on a per person level. Don’t get me wrong, I love living in a city like London or Chicago, so it is great to hear the doing so can actually help to lessen the damage, but my grandparents own 164-acre ranch and bit of me has always loved that life as well, kind of a throwback to English pastoral poetry. I could picture myself one day in the serenity of a farm set away from the city so I am also interested if there are means by which to make that sort of living even better than living to a city. As I mentioned, the city definitely produces lots of pollution and eating out in the city is only aids to the mass amounts of unnecessary importation of goods, as you also mentioned. Is the only way to become more environmentally living on a farm, compared to living in the city, by immolating the Amish model?
All in all, I thought the presentation was an excellent demonstration of all the factors we have been discussing in our class. Again, I am disappointed in FIE for not encouraging more students to attend. There execution thus far has been rather disappointing. I feel confident that this presentation will be one of the main highlights of their series.
Emily's Journal
The three biggest challenges that society is facing today are overpopulation, climate change, and a lack of natural resources.
First, climate change can be lessened with a few differences in the way that we live everyday. Of course, we have all heard many times what we are supposed to do to fix this. We should walk instead of drive and try and produce less waste, and lots of other things that are easier said than done, but still entirely possible. Technology can help out a lot in this regard, because we can develop more efficient public transportation that does not use chemicals and things that are harmful to the environment. Science can look to all of the causes of climate change, besides the elements in the air.
Another problem that faces society is lack of natural resources, this includes oil and water, among others. A way that science could help in this regard is by trying to identify other resources that could be used instead of oil and put those into use. And a way to use the ocean's water as drinking water would also be a big step in helping to solve these problems. Ways to bring water from areas that are have an abundance to areas that are lacking would also be a good development.
Overpopulation is really at the center of all of society’s problems. If there were not so many of us, we would not be lacking in natural resources, and we wouldn't be slowly destroying everything around us. One option to solve this problem is to do what China did, because that certainly helped the populations problems, but I feel that there were far more issues with that solution than there were benefits. Technology has already been developing contraceptives for a long time. However, more effective or easier to use contraceptives can be developed.
In reality, most of these things that science can do to solve all of these problems have already been discovered. Japan has the bullet train that makes transportation easy, packaging has been reduced in order to eliminate so much waste product. We know about electric cars and not to waste water. We have contraceptives that can prevent people from having dozens and dozens of children. Of course more can be done, I think that we will always be discovering ways to make our lives better and be less harsh on the environment.
But people don't want to do any of these things. People will not walk to work or take the train or the bus. It is not convenient People do not want to use contraceptives, for many reasons, one being religious beliefs. Los Angeles is sending a huge percentage of their fresh water into the oceans because people will not accept the idea of drinking recycled water, even though it is entirely possible to clean this water to drinkable standards. It's not so much what science and technology can do to solve these problems, it is what will it take to make people realize that what they are doing is not helping the world and that they need to stop. Perceptions need to change, a refusal to change the way we are living is the biggest problem that society is facing. I certainly am not advocating living in tents with no electricity or heat, boiling my own water to drink but I think that with what is already out there we can, as a first step, improve the way we are living and be on our way to eliminating these issues.
Atmosphere 1
The atmosphere exhibit at the Science Museum focused on climate change and the cause and solution. This exhibit was structured somewhat differently than many exhibits at other science museums I have visited. Throughout the exhibit there were many places that allowed visitors a more interactive view of the information presented. I found this to be very helpful and fun, because it is not all that often that people are allowed to play with things at the museums but it allows for more connection to the subject at hand.
I thought it was very interesting how much the exhibit focused on the human connection to climate change, including the roles that humans had in causing many of the problems, as well as what humans will have to do in order to reverse or at least end further damage to our environment. One of my favorite stations was the one where you tried to reduce carbon emissions now or in fifty years. Of course, to really improve the environment, change needs to start happening now. I think that because the language in the exhibit was not always easy to follow, these stations are good for children or less-scientifically inclined people such as myself. I discovered that one of the stations was not working as well as it should have, and that was very disappointing, because it seemed like the one that would be the most fun.
Overall, I really thought that this exhibit was really well done and I liked it a lot. It was good that although they talked about climate change, the basic science of the environment was included. The interactive stations were my favorite part, but the information that was included was also interesting to read.
Greenland Review
Greenland is a play about climate change, and it does not pretend otherwise. Overall, it was an interesting play with a good cast. I would not say that it was too preachy, but that it did have an agenda and there was no mistaking it. When it first started I was a little worried that it was going to turn into a musical, and was very relieved when it didn't. It was interesting to see a play that focused on climate change, because I have never seen a play with such a politically charged message. I feel like this was accurate scientifically. The program did not have a works cited, but I feel confident in believing their claims.
As an arena for speaking about climate change, Greenland was much more emotional than a textbook or a museum. Because the play focused on people and their action and emotions regarding climate change, it was much easier to feel connected to the subject. The arc with Lisa was the most interesting to me because she was shown as a person who was completely passionate about climate change and was willing to move away from everything she knew in order to fight for what she believed in. But then she met a man, and what she was doing became more about him. Her emotions became more important than the cause she was fighting for, and when she ran off saying she was going to join Greenpeace, It was more like she was giving up the fight altogether. In this part, and throughout the overall play, what people are doing about this was the most important message. So often in museums, what we need to do to change is explained, but no room for a transition is given. This way of giving us information about climate change demonstrated more of the human emotional side of the issue. People are not always willing to change, or they cannot fathom what is happening and therefore shut it out. I enjoyed this play and its subject, but I feel that the human element was the most important aspect of it, rather than scientific fact about climate change.
As we discussed in class, I think that most of the people attending this play already had similar opinions to climate change and were not there to have their minds changed. While I might be inclined to attend a play that I knew I would not agree with, I like to do stuff like that, but most people do not. Therefore, I don't know if a play is that affective at creating change with its message, unless of course, they surprised viewers with its contents after the play already began. Plays have tendency to be somewhat sensationalist and while I agree with everything they had to say, I think that was the case with this play.
Reflections on Climate Change
Over Thanksgiving break, I was able to hear many lectures about how climate change is not real and that rather than changing the way we live to be more environmentally sound, we should be preparing for the end times. I knew that a lot of people felt this way, but it was not something I was used to hearing on an everyday basis. However, I was never convinced to believe their claims, considering they did not have much evidence to back themselves up.
However, the Atmosphere exhibits and Greenland play did have evidence and science to demonstrate the claims that they were making. I feel like the exhibit was showing us what was going on in the world and what the future would hold. I came away from this exhibit knowing a lot more about climate change than I had originally, but did not feel that I was being preached to in any way. I did feel that I was at the play. At the same time, both mediums got their message across and I left both feeling like I knew more about climate change. If I had to pick my favorite, I would say the exhibit.
In a museum, it is sometimes like reading a fancy, interactive textbook. Textbooks are fine, but sometimes they can get really boring, no matter what the subject. I go to museums, especially science museums to learn something new, and because I do not know much about climate change, I wanted to learn more. Plays are much more about entertainment, and while I did learn something about climate change, I learned more about how people feel about climate change.
I feel like all of these mediums are trying to put forth the same message; that climate change is happening and if we as humans do not do something about it, our way of life is going to fall apart. We are able to get background on how we are creating the changes that are leading to future problems and what needs to be done to change it. There were some differences in how this was portrayed here and how I have seen it done in the States. I feel like in the States, there is sometimes less blame placed on humans. I couldn't imagine a play like Greenland being played at a conventional theater. People are so much less likely to accept that climate change is actually happening, or at least from what I have seen. To be fair, everything that we have done here in London is on the side of climate change, there could be a just as active anti-climate change population that I have not met yet.
Technology and Sustainability Talk
This lecture was much better than the previous one. It was actually about sustainability as I understand it. There was some overlap to what we have been taught in class, but I assume the idea was that more non-Earlham people would be there. At lunch that day we had talked to two of our classmates , suggesting they attend, but they were unconvinced, not even really thinking that sustainability is a problem.
I always like hearing about new technology because it always seems so strange to me. I think that technology is working to create a perfect world for us to live in, and some of the things that others are able to come up with make so little sense to me, that I cannot imagine what it took to come up with them. Some of the things introduced in this presentation, like the sky mirrors, are just ridiculous in my mind. Maybe they would work, But I cannot even imagine. But it was interesting to hear all of the ways that technology is working towards a more sustainable world, with both far-fetched and viable options.
More pictures, graphs or charts would have been nice, because visual elements like that help me to understand what is being said. The information about the new technology being created would have made more sense to me if I was able to see examples or diagrams. However, the lecture itself was very interesting and I did not have any trouble following along and did not get bored.
Science at Kew
At Kew Gardens, I was for some reason most excited by seeing the giant compost heap. The tour guide said that it was the largest in the UK, and this made it very important. It was also extremely difficult to find, because it was hidden by trees and what not. I suppose most people do not go to botanical gardens to see a compost heap, they go to see what plants are growing with the help of the compost. The science behind compost is certainly not new but it is important, in terms of fertilizing plants to help them grow, and putting waste products to good use. I feel like I frequently latch on to the most random things that I can in any event, and I am glad that Kew had giant compost heap that was somewhat hidden, so my day could be that much more interesting. Of course, other science there is more advanced and this was also nice to see. Biodiversity was something that I knew very little of, and I feel like Kew helped me to understand this.
Overall, I really liked Kew Gardens. It was like a giant park with better plants and more things to do, where I was also able to learn about nature. A big part of what they do is finding new plants and what they do and ways that they can be useful to people who live near them. As another way of encouraging sustainability, greater understanding of plants will make it possible to rely less on chemically made products and across the world shipping.
People need to have a better relationship with the plants around them, and learn how to use different plants and how to protect the ones that they are familiar with. Kew Gardens, through its research and the gardens, is able to help people realize their relationship with plants is important and care should be taken to understand and respect them. Their seed bank is something else that is extremely beneficial, because species go extinct all the time, and if Kew has a stock of seeds then if problems should occur, then the plant population could be built back up.
Astronomy and the Cosmos
1.
2.
3.
Assorted Chapter Questions
Johanna's Journal
Thoughts on Global Crises
- In your view what are the three most important challenges society in the near term (say 50 years)? Why are each of these so important? What does science have to offer for each? What does technology have to offer for each? Your entry should clearly address which are science based and which are technology based. You can describe both science and technology approaches for each of the problems you identify.
In the next 50 years, the human race will be facing challenges dealing with the health and welfare of our planet and peoples. Scientists claim that our window of opportunity to effectively counteract the effects of global warming is swiftly closing, there is a shortage of available, clean, fresh water in many parts of the world, and diseases like cancer, AIDS, and malaria continue to spread.
Science has already done a great deal of its part in dealing with issues surrounding global warming. Scientists have tracked and measure the rising amount of greenhouse gases in the atmosphere, sought explanations for strange phenomena such as changing weather patterns and decreasing wildlife populations, and discovered the impact of human activities on the earth and its systems. We know we must cut back on the consumption of fossil fuels and emissions of carbon dioxide, and now we must turn to technology to provide efficient and effective means of doing so. Wind, solar, and nuclear energy might all be part of the solution, but still pose problems such as waste management, expense of production versus profit, and energy distribution.
While science has provided us with a number of ways to clean water and make it potable, the problem seems to be finding ways to do it cheaply and efficiently, in order to make the technology available to people in the parts of the world that most suffer from water deprivation. Water cleaning and distribution systems must be affordable to and usable by people whose material and knowledge resources may be limited.
Finally, the spread of disease is a problem that we continue to deal with, and will in the future. While science has taught us a great deal already about the causes of cancer and the nature of the spread of AIDS and malaria, it is technology that we must now employ to develop cures and preventative measures. While we do not know how to "cure" viruses, we do know how to create vaccines to prevent them. Technology has provided us with malaria vaccinations, why can't it provide us with an AIDS vaccine? The issue here is not that we do not have the technology, but that the people with the resources to do so have their attention drawn elsewhere, usually to more economically beneficial endeavors.
Atmosphere I
The designers of the Atmosphere at London's Science Museum exhibit chose to feature several topics dealing with climate change. A separate kiosk addressed each of these topics:
- The impacts that future climate change will have on the Earth, and the choices that will be faced by the humans inhabiting it
- The Carbon Cycle
- The processes of Earth's atmosphere
- The history of climate research
- The causes and effects of greenhouse gases
The kiosks were designed to be approached in any order, and all possessed at least one interactive game or activity to supplement the informational displays. These made for a far more entertaining learning experience than the standard pictures/diagrams/artifacts with informative plaques set-up. Rather than making me feel I was being tricked into learning something, the interactive displays made the intake of information feel like an exciting process of discovery. I was really impressed with the way technology was employed in the pedagogy of the exhibit.
For example, in the kiosk that explained the sources and effects of greenhouse gases, there was a display that involved participants by inviting them to turn the blank pages of a book. Illustrations and text would appear on the screen that corresponded with the page that the book was opened to. While this may seem a bit gimmicky, I liked it because watching the technology work kept me engaged with the material much longer than I would have been if the same information was simply posted on a sign. Another favorite of mine was the game in which the player had to warm Earth's atmosphere by aiming the sun's rays through the clouds, and then holding in heat energy by moving particle in the atmosphere. This simple game was a lot of fun because it reminded me of the computer games I played as a child as well as what I already knew and had semi-forgotten about how the Earth keeps its inhabitants warm.
I felt that most of the information in the exhibit was not new to me, but it was nice to have a good number of facts and ideas packaged into a nice review that placed them into context with one another. Perhaps the most interesting to me was the kiosk about the the future choices that human civilizations will face in the future as they deal with the consequences of climate change. Strangely, this seems to be one of the topics least-addressed in the process of education about global warming. Perhaps this is because the topic is usually covered in science classes, where humanitarian concerns are not generally the focus. However, where responsibility towards the Earth might not be an argument that some people appreciate, responsibility towards fellow human beings might be more compelling. The interconnectedness between humans and Earth systems is something that is not really addressed academically until college. It would be interesting to see this become a larger part of the public conversation about climate change.
Something else I noticed about the Atmosphere exhibit was that it presented the facts supporting theories about climate change as though they were undisputed. In the United States, climate change is taught in schools as though it is a somewhat controversial issue, and something believed in only by liberal democrats. In terms of sources, most statistics and data were attributed to "scientists," as though the whole scientific community was in perfect agreement about them. I wonder if this is true, and the controversy surrounding global warming in the States is only a scientific one a a guise for political motivations.
Greenland Review
Greenland is pretty successful in its endeavor to address the problem of climate change from scientific, political, and everyday-human angles. What allows this success is the sort of collage of story lines and visual techniques that are employed within the play. Acting and technological effects were combined almost seamlessly. For example, in an opening scene, a young woman stages a protest at a grocery store, and the wall behind her displays information about the amount of packaging and transportation represented by various food items in the store. The swift transitions between scenes also contributed to the collage effect of the play.
I do not think I really learned anything new from Greenland in terms of "facts" or further scientific understanding of the phenomenon or consequences of global warming, but I certainly benefited from seeing the issues presented by the play put in context with one another. Greenland addressed the importance of the individual world citizen's response when faced with the facts of climate change, the political and economic challenges that stand in the way of making serious progress in the fight against global warming on an international and governmental level, and the various ways that different people interact with the natural world and think about their responsibility towards the planet. The combining of all these issues, along with some scientific facts and data, was a creative and refreshing framework from which to begin thinking about problems with climate change in a new way.
Reflections on Climate Change
The we've been talking about climate change issues in this class has made me realize how useful it is to think about the interconnectedness of and the interactions between science, technology, and society. One of our initial conversations dealt with the way that science and technology are both applied to solve problems for society. What is interesting about climate change is that it seems as though society itself is a large source of the problem. Science has told us the problems and their causes, and technology has provided us with a wide variety of ways to alleviate the problems. Scientists continue to produce more and more accurate climate models and engineers continue to improve the efficiency and practicality of alternative energy. It is society that continues to drag its feet. There are those who insist that scientist are misinterpreting the data, those who simply do not want to be faced with the responsibility of trying to fix the planet, those for whom the economic setbacks that implementing serious change would involve are too great. The earth will not be the same if the predicted effects of global warming take place,and while science and technology fight to preserve teh planetary environment to which humanity has adapted itself, society seems to refuse to take its proverbial medicine. While I had previously known a great deal of the facts about the causes and effects of climate change, during this course I've gained a better picture of the the way human beings interact with science and technology in response to these facts.
While the readings and the Atmosphere exhibit at the Science Museum both made important contributions to my knowledge about and thought process dealing with climate change, Greenland was the the outside-of-the-classroom activity that best complimented the issues we've been talking about in class. Seeing Greenland at the end of the unit brought me back to one of our initial class discussions about the interplay between science, technology, and society. It really helped bring forward the ideas I've discussed above. Both Greenland and the Atmosphere exhibit invited me to engage with issues surrounding climate change on a level that, while still intellectual, was also emotional. The readings really only invited me to engage with the material academically.
Something that really struck me about the scientific discussion surrounding climate change in the UK, as I've experienced it so far, is that it seems to take place in a much less politically driven space. In the United States, there are many circles where being highly skeptical of, or even denying, the phenomenon of human-caused global warming is perfectly acceptable or even the norm. These are almost invariably politically conservative communities. There seems to be far less politically-driven debate in the UK about the validity of scientific theory regard climate change. At Earlham, the idea that humans have contributed to dangerous rates of global warming is generally accepted, and anyone professing skepticism would surprise his or her fellow students. However, Earlham is also a place where many people assume that others share their liberal political views as well. And at Earlham nestled safely in the most land-locked part of a first-world country, there still seems to be little discussion of the drastic social impacts that global arming can have. The focus is more on finding every-day answers to the question of being a responsible citizen of the globe.
Science At Kew
Kew Gardens, funded in part by the public and in part by admission fees and concessions, is not just a nice park to spend the afternoon in. It is also an employer of copious amounts of scientists, a collaborator on one the world’s largest plant catalogues, and runs a seed bank to preserve a great number of the world’s endangered plants. When I visited the Gardens, I walked through greenhouses full of plants labeled with Latin names and arranged so that their genetic relationships with each other were evident. This gave me a view into the some of the sorts of knowledge that Kew’s scientists are accumulating, preserving, and sharing with others.
What seems most important to me about the work being done at Kew is that it is preserving and discovering an important part of the world that is disappearing. The loss of plant species means the loss of genetic sequences that describe traits that could be useful natural tools. As discussed in Science Matters, the world is composed of deeply interconnected and interactive systems. It’s hard to believe, considering this, that the loss of plant species is not something that could cause the human race to suffer.
Fibonacci At Kew
Technology and Sustainability Talk
The best things about Charlie's talk were it's optimism and his enthusiasm of delivery. Charlie is a pretty dynamic speaker, especially for a scientist, and his interest in this topic really came through in his expression and explanations. He highlighted technological advancements and possibilities that I was only vaguely familiar with and discussed how useful they could be in addressing problems surrounding climate change. I like the way his talk was organized, as well, with technologies categorized by the way they address climate change -- reduce, adapt, etc. This arrangement was very easy for me to follow and was a good way for me to mentally clump the talking points when I was thinking about them later.
The embedded and easily accessible images were also nifty, but I would have liked to see more of them, or more images in general. Something that tends to be tricky with power-points is creating one that allows you to change slides at just the right rate. If you have too little information on each slide, it's hard for people to hold overarching themes in their minds. However, lack of variety can lead to lack of attention. The embedded images seem like a good solution to this problem. You can show an image, and then move back to the original slide. I think a few more images to go along with each of the slides might have been nice, I sometimes found myself thinking, "Wow, it's taking a long time to get through this one slide. I wonder how many there are." Changing what I was looking at more might have helped with this mental distraction. The presentation had a lot of good visualizations of concepts -- graphs, Charlie's arm-span comparison to Earth's timeline, etc -- but I also found myself wondering what some of the pieces of technology he was talking about looked like. More pictures like the diagram of the open-source electric car would have been nice.
Overall, though, I enjoyed the presentation because it was a neatly packaged, optimistic, and charismatically delivered set of information that got me thinking about the future of the planet without that icky dread feeling.
Astronomy and the Cosmos
These are my questions about the reading:
1. I'm not sure I understand part about dark matter and how we know it's there. I don't really understand the bit about the spinning particles on the edge of the galaxy. I am also wondering, even if we can't see it, would we be able to feel it, taste it, smell it etc? Also, is this the "space" that is expanding like bread dough between galaxies? How could "space" expand if it is a vacuum?
2. It doesn't seem like the Big Bang Theory really explains the beginning of the Universe. There had to be matter already in existence -- in compressed form -- in order for it to expand. How do scientist explain how the original stuff got there? And WHY did it suddenly explode?
3. The book first says that all stars go through a cycle of birth and death, but then it says some stars manage to avoid collapse. Aren't these contradictory statements?
Ivan's Journal
First response
Overpopulation is not only the fact that there will be more people on the earth, behind that word lies is a huge consequence of earth not being able to produce enough resources. Because by increasing number of people on the earth we will still have the same amount of resources since it is a fixed factor that can go only down (example: fossil oil) Final consequence can be population collapse. This problem is more evident in developing countries because they do not have access to good “updated” education that will teach them how to conserve resources. Since they are also suffering economically they do not have access to birth controls. Most of them work in agriculture and have huge families because they think that one more mouth is acceptable to feed because two more hand swill be helping with the labor. It is approximated that on the earth are 6,896,700,000 people at this moment. And that every second ten people die while another thirty are born. Which means that every second we have 20 people more than second ago. In my opinion, the problem of overpopulation is still underestimate (and that is exactly why we are facing the problem) and majority of people do not believe that it is happening (same scenario happened with the problem of global warming – it was predicted many years ago but got significant attention recently). So I think that we should use science and technology in order to stress the importance of this problem on a global level. Scientists from different fields (Computer scientists, Sociologists...) can produce a great models of overpopulation that will be able to present their horrible consequence as well. And noways technology can contribute by handling those models (complex models with huge number of arguments).
Renewable energy is in my opinion very important and serious issue. At this moment, 85% of energy that we use is coming from fossil fuels that are fixed factor on earth and wont last forever. We can be free and say that nowadays world literally works and is dependent of fossil fuels. It is also well known that use of fossil fuels as another consequence will have creation of serious pollution. This is a great example where science and technology work together in order to produce something better, something called renewable energy sources. In my opinion green energy is consider as a serious problem and is getting significant attention. This problem will be solved when price of energy that is produced by renewable technology reach the price of energy that is produced by non renewable energy. This is a great challenge for science.
Clean water is a huge problem for some places at this moment. And the number of those places is getting bigger as time is passing. It is very scary and terrifying to know that ancient Romans had better water quality than a half of our population now. And that half of the world's hospitalization is caused by water diseases which results in 3,575 million deaths. This problem is in my opinion not getting the significant amount of attention because the people who control money are not affected with this issues at all. However, in my opinion this is a great task for scientists to produce technology capable of handling this problem. It is very sad to know that water covers 70.9% of the Earth's surface but some people are still having troubles to have it. By making technology that is very efficient in taking water out of air (and for that use renewable energy source like sun) we would help to many people. Another goal would be efficient and reliable transforming of see water to drinking and usable water should be another step closer to solving this problem.
I think that by fixing one problem we are creating another because in my opinion other reason why we are facing a problem like overpopulation is because some time ago we improved our medication treatment (which use to be issue before). By doing that we lover child mortality and increased life expectant. With overpopulation we will increase pollution...
Second response
The “designers of atmosphere” did a great job and on a very clever way managed to successfully (through interactive technology tools) show how atmosphere works, what might happen and what are our options in the future. I have learned many details but one that took my attention is the fact that the mixture of gases in the atmosphere has taken over 4.5 billion years to evolve. How hard and long it takes to create something but how short and little takes to destroy something. The most engaging kiosk for me was related to the section of “what we can do” and to be more specific it was a “green car” with “open source” technology that showed success so far (at least with software) :) I think that all kiosks were very engaging and I enjoyed spending time in all of them.
Greenland Review
I definitely enjoyed in this play especially because of great incorporation of actors and special effects. Personally I was very surprised that somewhere out in the world exists play like this, play about global warming. People who care about these issues are trying to approach to general public trough many different ways, starting from documentaries, newspapers, movies, web-pages, interactive games, radio shows... But I never before heard of approaching trough play. I was personally surprised by the number of people that visited the play and I was happy to see that this way of approaching and shaping public opinion really works. I learned some new things and after checking proved to me that they used very accurate facts in the pay. Hope that there will be more plays on this topic and personally think that this is a great idea especially because stressing the importance of global warming trough this media is very new and attractive to people.
Reflections on Climate Change
Many researches showed that a regular person is more likely to remember some facts after seeing it in a visual form (movie, and nowadays tether) than by reading it from the written form (books, journals, research papers...). That is the reason why tether and the museum were a bit more effective for me than the assigned reading. I also believe that interaction will attract more people because it is proven that people like to watch more than to read. I am glad to see that more and more people are starting to realize that global warming and the climate changes are happening more rapidly than they should and that people are actually the main reason for this. I am very sad to say that in my country, most of the population do not realize at all what is a global warming and what consequences is it bringing. It is because government is not spending any money on this very important issue. The reason for this is money and education lack. But at the same time I am glad that developed countries like United States and international organizations like United Nations care much more about this issue. I remember that Barrack Obama said in his State of the Union that United States aspiration is to take the leading position in the green energy production and stimulation.
Science at Kew Gardens
I was pleasantly surprised with our visit to the Kew. Honestly I could not even dream that I will enjoy that much. Beautiful weather contributed and placed that day to my top 10 London days. Kew Gardens has more than 500 employed scientists. With the budget of more than 50 million dollars they do different branches of science. Ranging from sequencing plants genes to discovering potentials of plants. In my opinion, the reason for success of this organization is in their internationalism (sending their scientists all over the world). Society already supports Kew Gardens work but I think that it should get even more support because this part of science is still not well researched (~10% is known to us) and I am sure that there are many good things buried inside of those, to us still, unknown plants. I see a near-term principle as a learning part because everyone can benefit from information that are presented and researched my Kew scientists. Also public can enjoy in many plants samples at one place. As a long term benefit I see it as a cure for many diseases and bank of plants. It can also be very beneficial to our successors especially if present population do nothing about global warming.
I found Fibonacci sequence very interesting. At the Kew I saw a few examples of it. In one of the water aquarium I saw a shell (mussels) that was a pure example of Fibonacci sequence. Other example of it at the garden would be pine cones and flowers. And of course the bridge :)
Technology and Sustainability Talk.
I definitely enjoyed in the presentation and really like the way you managed to incorporate and successfully connect and present “how did we get here”, “how serious is here” and “what to do in order to get out of here”. I personally think that it is an art to talk about those three things in such a short time period and make people understand everything and allow them to create their opinion (even if they haven’t had one before). I personally think that this presentation should be done at Earlham as one of the Earlham’s convocations. The only thing that I would suggest is more interaction with audience and try to encourage them to ask more questions. Great job :)
Science Matters ((Astronomy)&(The Cosmos))
Gillian's Journal
Greenland review I found Greenland quite a theatrical play due to the polar bear scene and the rain scene which I found quite outstanding. I also think the play did a good job in educating people about global warming and its effects due to the amount of details they provided. The actors were quite impressive too especially the actors who were delegates from Africa in the Copenhagen summit, their African accent was almost real. I wasn’t really impressed with the plot because it was hard to follow; scenes kept of changing from time to time each with a different story. Also even though a lot of details were given about climate change, global warming and its effects the play failed to give solutions to the problems. Furthermore giving out information about global warming through a play is not an effective method because firstly people have to pay to go see the play and they would pay if they are interested to know about global warming. If they are not interested they would not go and therefore would not get any information about global warming.
Reflections on climate change a) The main message on climate change is that it affects the earth and its inhabitants and the results are catastrophic for instance floods and global warming therefore people should reduce activities that lead to climate change and start using things that are environmentally friendly. Also greenhouse gases emission brings more global warming therefore people should reduce activities that encourage greenhouse gas emissions and should find other alternatives. b) I found museums more effective at communicating the message because it was more interactive. I learn more when I participate in the learning process rather than just sitting down and reading something or watching something. c) I don’t think there is any difference at all, both England and my home country plus Earlham almost have the same message on climate change which is reduce greenhouse gases and use resources that are environmentally friendly like renewable resources to fight global warming.
Science at Kew At Kew the science involved includes genetic research, conservation of different plant species and seed banking. The palm house was one of the evidence of scientific underpinnings in Kew because it was a collection of different plants from around the world and they were all planted and preserved in one place. Kew is important to society because it has the seed bank that stores seeds that can be used if any specie is becoming distinct or if species are wiped out in catastrophic events. Also pharmaceuticals can be made from the plant dry and be accessible to the society. People can also go to Kew Gardens as an area of attraction and spend time with their families in the beautiful gardens. Research is beneficial to people because they get to see different plants from around the world easily since they are all preserved in one place and they also learn more about plants.
Technology and sustainability talk
I liked how this talk mainly focused on the way technology can be used to help reduce the problem of climate change and globalization and the way the lecturer gave further details on how those technologies work. However technology can only be easily available in developed countries and this made me wonder what the developing countries can do to fight climate change and globalization without heavily depending on technology. Things like smart grid, super grid and electric or hydrogen vehicles cannot easily be accessible in developing countries therefore what can developing countries use as an alternative that can be easily accessible to their countries to help reduce global warming?
Lily's Journal
Technology and Sustainability Talk
I found Charlie’s presentation to be very engaging and thought it offered an informative look at the changing role of sustainability in an easy to understand format which integrated nice anecdotes, history, and current events. While I remembered some of the things from other in-class lectures it was good to hear them again and I felt that I had gained a better grasp on what sustainability means in the status quo after hearing Charlie’s presentation. I thoroughly appreciated the fact that he went into the presentation on the assumption that the audience agreed with the FACT that climate change was occurring and that human behaviour had some effect on this change. If I were to change anything I would maybe try to make the talk a bit shorter but I also cannot think of anything that I would cut from it, in fact the presentation seemed a bit rushed towards the end so perhaps shortening it is not the best idea. I like that Charlie chose to look at sustainability from a more objective view than many other talks on climate change do, he recognised that some solutions presented as “sustainable” aren’t necessarily so and some not really viable at all. It would have been interesting (were the talk to be given in the U.S.) to look at current policy natives (if any) that are either being debated, have passed, or that have failed.
Science at Kew
Much scientific research occurs at Kew and aids in global conservation. One of the main projects by Kew is their Millenium Seed Bank Partnership which is working to save those plant species risking or near risking extinction. Currently 60,000-100,000 plants are facing extinction (source: Kew.Org) so this partnership to preserve and maintain these species is vitally important and is one of the benefits of Kew research. Society should support Kew because of work like this, which is helping to save seed species worldwide, if critical plants become extinct it affects our air, our food, and the livelihoods of nearly all people worldwide. The Kew website notes the importance of the plants they work to save each day quite nicely by noting, “We need plants, because plants are useful. Plants provide the air we breathe, they provide clean water, fuel, building materials, fibres, resins and we all rely on plants for food.” Kew also understands that a key part of climate change and conservation is maintaining plant diversity and they work towards this in many locations worldwide. Plant diversity not only helps remove carbon dioxide from the atmosphere but can also help by negating the negative effects such as deforestation and extinction of other non-plant species. This commitment to plant diversity is seen in the vast array of exhibits at Kew garden demonstrating the impressive varieties of healthy plants Kew has at their gardens and how they are working to maintain this diversity in their other locations around the world, such as the colorful plants seen in the “Tropical Extravaganza” exhibit. The long-term benefits of the science at Kew are increased and healthier plant and bio diversity, a reduction in the negative effects of climate change, and the prevention of species extinction. The short term benefits are education and conservation both on a community level and at their various sites around the world and through the information available on their website and at their enormous on-site library.
Reflections on Climate Change
The question isn’t whether climate change exists but rather what can we do to deal with the status qupo and inherent changing climate of the future. The main point that I took away from the last few weeks of studying climate change was that something needs to be done and that we cannot continue to consume and consume in the ways that we have (and which has only increased) and expect the results on the climate to someday turn around. So the question than becomes what do we do, it is easy to not feel like recycling your one plastic bottle will make much of a difference or taking your coffee in a to-go mug as opposed to a paper cup each morning but collectively if society moves towards a more sustainable and less hyper-consumptive culture we will begin to see our negative impact on the planet decrease. It is absurd for us to assume that we can continue to build this culture based on consuming and expect the rest of the world to follow this western model of development without vast environmental impacts that will someday be absolutely devastating, as seen in each medium of climate change we have looked at in the previous weeks. The medium I found most effective was the theatre because it presented the information in a way that I found to be engaging and easy to listen to. While I enjoyed the Atmosphere exhibit and found it to be extremely comprehensive I felt a bit overwhelmed by all of the different kiosks and interactive activities (perhaps it was just my ADD).
When comparing the message of climate change to that back in the States and also that at Earlham I think there are certainly both similarities and differences. As touched on in my Greenland review I find my first inclination (despite this not being true) is to think about climate change as a politically charged issue as opposed to something of science. This certainly seems like the American mindset to have, which makes sense when we have countless politicians and “journalists” telling us climate change is nothing more than a scare tactic or hoax and denying the overwhelming scientific evidence. I find the culture towards climate change in the UK to be much more accepting of the fact that it is occurring and mostly of the fact that it is in some way caused by the actions of humans, something unfortunately not as widely accepted in the States. In the UK the greater question seems to be not IF we should do something but WHAT should we do in regards to climate change, which is not exactly how it is debated on the floor of the senate. I find that the attitude of the UK is much more similar to that seen at Earlham, I think one would be hard-pressed to find an Earlham student that denies the existence of climate change and thinks that inaction is an option.
Greenland Review
I enjoyed the production of Greenland and found it to be an interesting medium to present such an issue. While miy first inclination is to find it odd to see a “political issue” presented with such a slant and sponsored by the national theatre the more I think about it climate change really should not be a political issue, or rather it is not a political issue—its an issue of science and facts. What has made it a political issue is the spread of misinformation by the media and other not so scientifically affiliated individuals and politicians. I digress…back to Greenland—I felt that it presented a nice intro to climate change with many facts being integrated in a way that was entertaining and palatable for us not so science-y individuals. Overall I felt that I pretty much knew most of the information that was presented in the play (from classes, news articles, readings, etc.) but it provided a nice refresher course on climate change in a new and engaging format.
Atmosphere I
I really enjoyed the Atmosphere exhibit at the National Science Museum but found the sheer amount of information to be a bit overwhelming and felt over-stimulated by the amount of lights and engaging kiosks. The exhibit seemed to offer a pretty all-encompassing overview to climate change both covering its history, current events, and possible solutions. I thought it was interesting to find out how ancient ice cores are analyzed to figure out the carbon dioxide and temperatures at the time of their presence. The most engaging kiosk that I found was the climate modeling game in which you worked as a climate modeler and were promoted to new levels based on how realistic and applicable your model was. I liked this kiosk and found it engaging because I felt interested in learning what made an accurate climate model for the future and was engaged because of the simulation style game it presented the information in. My least favorite kiosk was the one that was like a book that you flipped through and more information would appear on the computer screen in front of it. This was my least favorite kiosk because I found it to be very text heavy and not very engaging. I feel like the science and technology element was very present in the kiosks and throughout the exhibit both looking at the science behind climate change and the technological innovations scientists are looking towards as solutions for its affects.
First question
I think the three most important challenges facing society in the near term are access to lifesaving medical treatment, alternative energy sources, and accessibility/availability of clean water. Access to medical treatment is growing increasingly important as the medical problems facing society grow more and more complex. Currently drug companies have few incentives to research and create low cost medication and treatment for diseases affecting much of the developing world such as malaria, AIDS, etc. As for profit companies they are less interested in providing medication to those that can least afford it and more interested in creating new drugs marketable to the already prescription heavy industrialized north. The future demands that drug companies and researchers look for solutions to help those most in need not just those with the deepest pockets. The global reliance on the finite resource of petroleum urges us to find alternative energy sources to fuel the future. There is simply not enough oil in the world to sustain our consumption. Like oil water is also a finite resource which is already not accessible to some parts of the world where it is most needed. Finding new sources of clean water is essential as we move into the future. In addition to clean water sources it is also critical that we develop solutions to make sure everyone has access to some source of clean water, whether this is coming up with cheaper more effective water-purifying technologies or more efficient ways to build wells in rural areas, something must be done.
As far as medical treatment science can provide research about key medical issues such as cancer and the causes surrounding it whereas technology could use this research to create new more efficient medications to treat disease and other medical problems. Technology can be further applied by looking at better ways to distribute medication to those most in need, i.e. by producing generic AIDS medications in countries most affected by the disease you can be quicker in getting the drugs to those most in need. Science can be used when seeking out alternative energy sources by researching new forms of energy and technology could be used by converting this energy into a usable form that is accessible by consumers. Technology can also compare new forms of energy against old forms to determine which is most efficient for the differing needs of the globe and least detrimental to the environment. Science can be used to research how much clean water is left on the planet and where it is located and technology could be used to actually seek out these water sources and distribute them to those most in need. Technology can also be used to innovate new ways to purify water and make it suitable for drinking.
Bill's Journal
First question.
- First response.
1. Racism/prejudice: Born from ignorance and fear, false constructs of identity based around skin color, nationality and gender have perpetuated violence and oppression over the past three hundred years. This issue is by no means absent from our present lives, seeping in though advertisement, culture, and almost every imaginable facet of social media. I would argue that Education, science and technology being vital to its success, is the only means by which prejudice and racism can be dispelled from our lives.
In the past, science has been a double edged sword. We have seen that when placed in the hands of those who would propagate injustice, “scientific findings” have been used to justify some of the most violent and horrific events yet known to man. However, as scientist have moved away from bias, the false claims utilized by Nazi, and eugenic scientist have been dispelled. The clarity we have attained through studies of human DNA prove conclusively that there is no justification for judgments of value between different phenotypes.
Technology offers us a chance to spread these findings, and in fact, to further examine the positive qualities shared by all peoples. Not only does technology offer us a chance to refine our study of DNA, but further gives us the ability to disperse information and improve education. Computers, as they become cheaper and portable, offers a comparable proliferation of knowledge last seen after the invention of movable type in tandem with the printing press. Of course, both science and technology must be kept in check so that their findings and creations are not interpreted for the sake of the privileged and malicious.
2. Labor: Of the many arguments facing those who advocate communism is how to find a way to insure the freedom to pursue greater callings while at the same time assuring the supply of food and goods are maintained. I would argue that although one could not be more alienated from Labor then by the replacement of the man by machine, technology offers up the possibility of reducing labor requirements in sectors such as agriculture and production allowing for the discovery of humanity's greater potential.
       Thanks to technology, namely Global positioning satellites and artificial intelligence, tractors can plant, water, and harvest without a farmer.  Assembly plants likewise can be automated and left almost unmanned. If we can execute a metal shift that stresses that our strength is not found in the excess we can produce, but simply in our capacity to insure our survival, technology can offer us freedom from consumerism.
       We cannot make man into a machine, as capitalist have attempted to do,  but instead we must simply free him from labor that generates the alienation brought about by the need for mass agriculture and industrial production . Hence, though technology we may finally free humanity in order to bring out those products that only humanity can offer; scientific, political, artistic and philosophical thought.
3. Drug addiction: Addiction is, of course, nothing new to humanity seeing as narcissism was born along with identity. New designer drugs however, bring to the fore a nemesis to health and wellbeing never before conceived. Meth is just one of the long line of drugs who’s origin rests comfortably with, ironically enough, medical science and technology. Although we can blame science and technology for the proliferation of drugs in recent years, we must admit that science and technology are amongst the few human endeavors which can indeed, dig themselves out of their own shit.
       The study of the human body gives us insight into how and why a drug works. By studying the process by which the brain and body become addicted we can come to a better understanding of how to counter it.
       Drugs, (although methadone and cocaine are in fact, the result of such a process) can embody our scientific understanding of addiction. We can develop new methods of treatment in order to counteract the effect of various hard drugs. Technology's shortcoming is that it can never overcome the stupidity inherent within man.
Atmosphere 1:
1.Which specific aspects of climate change did the designers of atmosphere choose to focus on?
Our exploration of the "Atmosphere" exhibit at the Science museum had a total of five major areas. The first area was a semi-comprehensive explanation of how climate works. They provided and interactive model of the earth that demonstrated how the earth's rotation and sunlight were affects involved in the generation of various climate zones. They also offered various geological segments demonstrating the effects of varying climates. Sequentially, the designers presented what this meant and how we could bare witness to it in our immediate environment. next they gave a review of the scientist who noticed the effects of industry and pollution, and offered a slight review of the consequences. the final two sections focused on how the world, people, and life in general would be affected by climate change and the overconsumption of fossil fuels. then they demonstrated various methods via various means of as to how we would counter and reform our modern tenancies.
2.How well sourced was the science and technology discussed in the kiosks?
For some displays, we were offered little to no recourse to who or when information was formulated and accepted. Although, for each kiosk, a computer was provided that offered observers a chance to explore further, let me just say that MLA format was not employed. Only the section focusing on contributers to the scientific revelations, which predicted the risks at hand, were in any way provided for.
3.What was the most surprising thing you learned?
One can measure temperature, carbon levels in the atmosphere, and major events by examining ice core samples taken from the Antarctic.
Which of the interactive kiosks did you find most engaging? Why?
The games, which were prevalent and associated with almost every section of the display, offered the surreal opportunity to participate in every level of climate change and atmospheric science. Being able build a successful climate and at the same time rain destruction upon it, and then correct it in an simulation of the political world brought a feeling of investment and interest. When i was made to care for my own investment, i was also inspired to care for the science behind what i was fighting or propagating.
4.Which of the interactive kiosks did you find least engaging? Why?
Unfortunately there were two kiosks that were typically disengaging. At every kiosk, one could explore the encyclopedia of information that supported the section. Although you could see a tree of data, the display failed to engage the user for there was no reason to look deeper. the display was too passive. In a way, displays which merely fed information without asking from the viewer failed to gain attention. Waving my hand does not ask that my intelligence or understanding be applied. Clicking on various characters and choosing the simulation that foretold their doom does not entice me, for what is at stake? Games, on the other hand, gave me something to care about.
Greenland Review
Our viewing of Greenland was a immersive experience into the world of English political theater. The play focused on the lives of individuals caught up in an environment permeated by Climate Change. From the perspective of a young girl who faces a bleak future at the hands of her oblivious partents, to the metaphysical moral delema placed on a game show participant, the play exhausted the range of narratives within the typical leftist trope of political frustration.
The play, although well written and engaging, fails to account for several major issues surrounding both climate change and the proliferation of discourse on the subject. The most apparent issue, one the writers made clear, was that the audience was of the middle to upper class population who can afford, and are primarily absorbed by the climate change debate. Theater appeals only to a select crowd, namely those who can afford both the cash and timely cost. The play also suffered from appealing only to one political demographic, ie liberal white octogenarians and former hippys, if not the “revolutionaries” predestined by their personal leanings to attend. Due to this phenomenon, the play failed to reach a greater audience. if the play pointed out one thing clearly, its that we are all doomed.
This was another fall back; that no resolution was reached. The only finality came with the passing of a researcher in Alaska who for the length of the play, hallucinated his childhood experience. The viewer was left with the impression of impending doom, and no recourse to fighting global warming. On the national end, nations could not agree to cut emissions. Political activism in the lives of individuals was useless due to a vastness and inconstancy in constituent groups and misunderstood by the generations who did not feel the weight of the situation. The game show contestant ran off stage without revealing any victory or prize money, and only after concluding a speech on the short comings of putting all of ones eggs in one basket. Lacking any outlet, other than despair that is, to fighting climate change comes with either total cooperation or little hope we can place in individuals fighting for a cause. It seemed strange to my peers and I that such an emphasis on science, players stating repeatedly that “science can do anything” , but offer an understanding as to how to counter act the change.
If nothing else, this was the final nail in the coffin. A great amount of scientific information was provided, although without much citation. It was also mixed in with a “simulation” of the worst case scenario. The convoluted presentation of information, regardless of formal theatrical professionalism, damaged the credibility of the play. The Science may be proven and reputable, but they certainly leave room for doubt. As my dad once said to me “Bill, if someone is shouting at you, it means they don’t thing you will believe them. Chances are they don’t believe it themselves.”
Over all the play was entertaining, and cleaver. The political goals however are undermined by the nature of the medium (theater), and an analysis that is typical of a fatalist. I wonder if they sort out and reused the paper dropped from above throughout the play. That way, when the end times come, we will still have something to burn.
Reflections on Climate Change
It is not a question, nor has it really ever been a question for me, whether or not the world is changing. From a rather esoteric standpoint the question seems absurd. What does need admitting is this: the Climate is soon to deal a great blow to life of the earth, and humans stand to lose the most(human-centric of me, I know). Many sources can tell you about how and why this has happened, and offer up many alternatives for obstructing the downfall of the climate as we know it. A reaction like this however, is not warranted. Greenland, a play we watched as a class, suggest that all is lost! That is only so if we think of the demise of our civilization as some sort of catastrophe. Yes, I will admit that sleeping without a mattress can really hurt, but that is the cost of making too many beds! We also need to see the world as a greater, organic being who does not deepened on skyscrapers and sliced bread to propagate life. I have come to understand that the future is inevitable, but providing now, what we need to sustain life on a level close the current standard of living is exactly was is required.
I came to this opinion only after a conflagration of mediums were made available to me. Each had a different temporal effect on me. Theater made it an emotional issue, while a museum offered the space to interact with the science involved with understanding climate change. Reading provided the bare bones of scientific fact. IF I had but one, say the interactivity of the museum, the reality would not dawn on me that climate change is more than a mere game, that living beings with emotional value stood to lose something from climate change.
I am optimistic about the wide variety of mediums available to me here in London. There is a real drive to generate awareness on the issue. At Earlham, we cannot get enough of climate change this, and climate change that, and so it feels like home. At Earlham however, it seems that we can be insincere in our investment. Students, more pointedly, are engaged in a process of appearance, i.e. climate change is something that brings you into the social fold. This does not remove Earlham and London from having a positive impact on the worlds awareness of climate change. When Students discussed the Fetishizaion of the Individual they pointed out how capitalism can suggest participation via products that limit the responsibility of the individual to the community. I hear lines such as “oh, I brought my canvas bag with me in the jeep when I went to Jewel down the block, dear” every day in North Suburban Chicago. Free museums with “Atmosphere” displays are for more impressive on the mind and offer a greater awareness of the science behind climate change.
Science at the Kew: I have had a strange relationship with botanic gardens ever since my senior year of high school. Me and a Friend went to the Chicago Botanic Gardens hopping to find wild sanctuary and lush preserves natural environments. No, we found a museum about gardens. This was the problem i found with the Kew. It was beautiful, but few people could do much more with the actual science that marvel at that to which it refers. In other words, angiosperms do not mean much to visitors, even though they mostly "ooed and awed" at flowering plants. The encyclopedic character of science often scares people away, and damaging public appreciation for science. Still, when the sun breaks through the clouds and the flowers bloom, the Kew offers us a chance to really see the world we could lose to our own Hubris.
Second question.
- Second response.
McKayla's Journal
Science Matters, Chapter Questions
This is a place to post all questions over the chapters we read in Science Matters.
- Questions #1: Energy and the Universe: 23/1/2011
The second law of thermodynamics states that “energy always goes from more useful to less useful forms” (27). Hazen also defines useful as concentrated. If energy is more concentrated it is more useful and vice versa. From what I understand, energy that can be used is energy that can be made to do a desired work, such as pushing down a pistol. The lost energy due to friction and waste heat are unusable and therefore un-useful. Is this correct? Could you clarify this?
On pages 30-31 Hazen maintains that mass is another form of energy. Einstein’s very well-known equation is E = mc2 . Could you give an explanation of how mass is related to energy. I know it’s well known but a more thorough explanation would help a lot.
Do batteries use a form of convection? How do batteries work to store energy and release it over time? Are batteries efficient?
Could a car be double powered with two engines, one that runs on higher heat and the other that runs on cooler?
Could you do a refresher on the equation force = mass X acceleration. Basically, what units are those measurements in and how does the answer help scientists?
On page 5 there is a diagram of Stonehenge. Could you explain where the light goes and what indicates the passing of time more thoroughly? (Also, may we go there?)
How is it true that the Universe regular and predictable and systems move towards disorder at the same time? Are those two concepts separate?
- Questions #2:
How do you express latitude with only the degree and a decimal? (i.e. What is the calculation?)
What do the letters used in the global reference frame denote?
- Questions #3: The Atom: 07/02/2011
All matter is made of atoms that are indivisible. Is the age-old tale that splitting an atom causes an atomic explosion really true? If so, how does it work? If not, how is an atomic explosion generated? Are atomic explosions only man-made events or could they happen on their own in the natural world?
There was a mention about exciting electrons to push them to outer valence shells. Could you illustrate how this happens? How can an electron be excited with energy and moved to an outer layer if each valence shell must be filled with a set level of atoms?
Does each electron have a unique path even if it is with another electron in the same electron shell?
What is antimatter? Is antimatter composed of things that are not atoms, but anti-atoms? What happens when matter and antimatter meet?
The Future of Science and Technology for Society
- In your view what are the three most important challenges facing society in the near term (say 50 years)? Why are each of these so important? What does science have to offer for each? What does technology have to offer for each? Your entry should clearly address which are science based and which are technology based. You can describe both science and technology approaches for each of the problems you identify.
It goes without saying that the next fifty years will encompass a plethora of new advances in science and applications in technology. The three most important challenges facing society in the near term will be ones that prevent instabilities. To be more specific, it is in the interests of the prevailing systems of power to finance and encourage researchers to come up with solutions to problems that have the potential to generate civil war and political unrest. The three most important challenges will be concentrated on manipulating the natural world to relieve or eliminate the dependence of all nations on oil, to create ways to make and bring fresh water to all portions of the world population, and to create more efficient, safer methods of mass transportation.
The first challenge is important because governments are investing a lot of money and risking countless lives in wars whose central importance is to have access to the oil that is used to create the majority of electrical power in their respective countries. Lives will be saved because those individuals will not be sent into a war. Human rights will be upheld because tyrannical dictators will not be installed who have agreements with the US to not jeopardize the US’s access to oil. Furthermore, turning from a non-renewable resource and investing in the technology to draw energy from a renewable resource will sustain itself. For this problem, science is concerned with researching the creation of energy, focusing on the reactions of atoms they had not studied with that prerogative in mind. Technology uses the discoveries of science to create efficient, low-cost machines that harvest the new forms of energy scientists have studied and proposed engineers should and could harvest.
The second challenge is important because of the real fear of water wars. With growing populations, hoarding of fresh water by countries, and the problem of distribution, water wars could turn desperate people into perpetrators and victims of widespread violence. Science could investigate the natural process to desalinize water present in the water cycle and research how desert plants gain and store water. Technology could use the information uncovered from science to come up with machines to cheaply and efficiently extract the salt from sea water and therefore make more drinkable water available in general and in places where it usually is not available. As well, technology could improve and create new ways to transport fresh water. They would use the laws of the natural universe - such as gravity, physics, and thermodynamics - to do so.
The third challenge is important because public transportation is not being used efficiently and cities, specifically in the US, are not laid out in an efficient nor compact manner to make them accessible to everyone regardless of income. Science could discover new ways to get energy from alternative sources or gain more information on the current system to more efficiently continue to use it. Science could examine the migration patterns of animals, specifically ants and birds, to question whether their systems of movement work to organize masses of people efficiently. Scientists could also investigate where most people go on a regular basis and traffic patterns to give the information to technology makers. Technology could then come up with viable routes and use enough vehicles to transport the correct amount of people. Technology could also refine transport to accommodate the change from oil energy to alternative energy
Atmosphere I
- Which specific aspects of climate change did the designers of atmosphere choose to focus on?
Today, climate change is synonymous with global warming. If scientists talk about solutions to climate change, they are talking about ways to reduce the rate at which the planet is warming. To make something clear, climate is different than weather; weather is unpredictable and varies daily while climate is used to describe the measure of an entire atmospheric system over a large period of time. A colder winter is therefore possible when world temperatures collectively rise. Due to the proliferation of global warming literature, some individuals forget that climate change can also describe trends in global cooling. The majority of the Atmosphere Exhibit at the Science Museum kept with the concerns of today by focusing on aspects of global warming. There were interactive displays that described how an excess of carbon dioxide can accumulate in the atmosphere. There was an interactive game that introduced a viewer to the technologies that help decrease carbon dioxide output, increase efficiency, utilize alternative sources of energy and increase awareness of energy usage.
- How well sourced was the science and technology discussed in the kiosks?
I was not explicitly made aware of research sources the kiosks got their information from. However, I could have been distracted by the wealth of information I did not know and the high level of engagement with each kiosk to pay attention to any small print or spoken references by the automated speaker when the game ended.
- What was the most surprising thing you learned?
All the information was interesting. There is no clear winner for most surprising though. The journey through the history of climate change interested me. I learned that La Nina and El Nino account for extremes in weather in cycles. I read about the Little Ice Age that took place from 1350 to 1850. Not that far ago, the Thames completely froze in the winter and people could ice skate on its surface with relative safety. I wonder how cold that had to be. I am really happy it does not snow here that much any longer, especially since it is winter right now. Other interesting facts have to do with later dates. The Ice Age caused the Norse peoples to migrate South to warmer climates. I also learned that dragon flies the size of seagulls and three-foot long scorpions evolved because of high levels of oxygen in the air. Because the air was less humid, large reptiles were able to dominate the Earth.
- Which of the interactive kiosks did you find most engaging? Why?
The interactive kiosk I found most engaging was the game about Thames river level rising. Based on a lot of studies, the water levels of the River Thames were expected to rise between two different estimates. Entire housing districts were at risk along the river. The object of the game was to build up protective barriers to protect the most amount of houses with a set building budget. The game had a time limit. It was engaging because it was limited by time, restricted by budget, and was based upon varying sets of conflicting data about climate change, which I think is the basic formula for development that combats the effects of climate change. I felt like I had to account for many factors. The pace was quick.
- Which of the interactive kiosks did you find least engaging? Why?
I found the carbon cycle interactive kiosk to be least engaging. Users were supposed to place a block on a point on the grid to learn how different aspects of the carbon cycle worked. However, one of the blocks did not work. The animation was slow as well. I was bored with the speed and how elementary the animations were. I guess I am attracted to flashy, quick paced, and exhibits that mentally engage me.
Greenland Review
In the United Kingdom, part of each citizen's taxes goes toward funding the arts. This is problematic because the people who allocate all this funding may channel more funds to art with messages they support. It would make sense if plays that challenge the existing power structures received little if any funding from this arena at all. Furthermore, It would make sense that some plays change their endings and original writing to appear less challenging to the prevailing hegemony. Greenland was a play that had the potential to present a lot of problems to the audience. It could increase the scope of the problem to cause a sense of helplessness. It could present different arguments that would need different strategies of action to assure the continuance of humanity and other living creatures on this planet. It could confuse the audience. It could empower the audience. As a viewer who was not used to the government-funded arts, I was doubly skeptical because the play itself was being performed at a government building as well. The Royal National Theatre had the potential to be class-exclusive, artistically stagnant, and full of unbearable snobbery. Greenland itself, I thought, would work present an argument to work around the existing oil-powered infrastructure because today government is concerned with business and the biggest business is oil.
I am ambivalent after seeing the production. I feel the theatre went out of its way to foster intelligent debate and continuing research, which indicated a government-led imperative to increasing the education of its citizens. A positive feature was the refutation of the element of 'belief'. As a quote at the beginning of the play stated, scientists disagree about when and how much warming will occur, not whether it is happening at all. Despite all this good, I feel the play was disheartening because it illuminated how large a scope the problem is and illuminated that there is not one solution. We are unable to predict the future and are presented with challenges, although few, to decrease our impact on this Earth. So, although it was very intelligently written and impressively performed I left the theatre feeling helpless and unsure of what to do. This is not the mindset of an individual who will go out of her or his way to decrease their impact and encourage others to do the same.
I felt that if there was a list of sources the play used available for purchase, it would be more accurate. I felt that if the audience was assured that the massive amounts of paper, plastic, water, and electricity came from environmentally friendly sources, the plays message would have been taken to heart. For example, the paper could have been paper that was recycled from other sources, the plastic could have been twice used plastic, the water could have been reused for each production, and the electricity could have been provided from solar panels or wind turbines. In that way the medium would have been effective to convey the theme.
Overall, it was a visually impressive production that presented the bleak picture many of us succumb to either through how seemingly powerless we as individuals are or how much work science and technology must do to present more of the patchwork solutions that are needed in this various world.
Reflections on Climate Change
Recently, we as a class have done readings to increase our scientific literacy, have explored an interactive exhibit about climate change, have gone to the theatre to see a new play about global warming, have listened to a podcast about young people ambivalent and confused about climate change, have travelled to famous places where scientific discovery took place, and have explored different areas of science. These methods - readings, museums, theatre, radio, and travel - cover a vast majority of methods through which individuals not in science careers receive their information. Another method of information gathering is television. The masses elect representatives that express the views they have formed after being bombarded with all this information, some of it misleading and many of it confusing. A scientifically illiterate society will be damaging to our future as funding is cut for programs the public does not know much about to form a logical opinion about.
- What do you believe the take-away message to be?
From all of these venues of information, I think the take-away message is to gather as much information as possible, to strive to understand that information, and to decrease one's carbon footprint now in ways one can until more research yields even more patchwork solutions or until the oil infrastructure is overturned by a global coalition of nations and individuals. With the price of disheartening depression about finding any positive in the future at all, the underlying message is to not subscribe to positive ideology because as much as we would like to think there was one giant solution to it all it currently does not exist yet and there will need to be many different solution in many different regions of society.
- Which of the modalities did you find most effective at communicating that message: reading, museum, or theatre? Why?
I, personally, felt the theatre was the most effective means of communicating that message to myself. I was entertained by the acting and special effects and I was engaged with heavy ideas. I feel that a short, compact, entertaining mode of communication is effective at getting the majority of the points across to individuals (who have the money for theatre tickets, of course). Reading and going to the museum give you the information at a slower pace and you may not read or see everything you need to in order to get a wide picture of the situation. In addition, the scientific jargon may be a bit heavy to wade through for the average individual who is, by definition, scientifically illiterate.
- What's different about the message here in England than what you hear in your home country about climate change? Different than at Earlham?
In England, I was surprised to find a society so engaged with alleviating the negative environmental consequences that come with today's industrialized society. I suppose it is because the area, being an island, is so small that negative effects on the environment are immediately felt. In addition, the nation is invested in improving the health of its citizens. Therefore, chemical emissions are a negative financial burden to tax payers in the country and governmental policy reflects that. My host mum told me that recycling is a norm here and if she does not recycle, the recycling employees will go through her trash to sort it and tell her about it. This proactive environment that puts environmental concerns near the front of policy objectives directly conflicts with that of my home country, the United States of America. There, we have politicians who deny that the planet is warming outright. These representatives are negative to any environmental policy if it causes a financial burden to businesses, increases governmental expenditure, or creates new bureaucracies. It would be unfair to say they are adverse to the welfare of citizens because they do not protect the environment their constituents live in and therefore everyone's health. Instead, they are concerned with the welfare of individuals because companies may have to cut jobs to account for the added expenses of being less detrimental to the environment. Therefore, there are more individuals and families without the means to procure the basic necessities of life. In the United States, keeping the economy afloat and managing to not accrue governmental debt are the two main imperatives. There are two parties in direct opposition who advocate different methods to achieve generally the same end. Within the party whose central objective is to keep the economy afloat and decrease the financial debt for running the government, there are a small faction of ill-informed individuals who refute all scientific findings about the reality of global warming and the ensuing threats to humanity and other living things. Due to the enormity of the United States, there is not as massive of a movement for recycling, composting, and household technology powered by alternative forms of energy as in the United Kingdom. At Earlham, the majority of the students have the intention and motivation to enact real change that will decrease their footprint on the environment and this objective is reflected in a campus-wide recycling program and environmentally friendly technologies in academic buildings. The difference between the UK and Earlham is that the UK is burdened with the enormity of their domain whereas the smaller scale of Earlham allows more discussion and policies. All three environments - the UK, the US, and Earlham - are subjected to financial limitations and the obscurity and very early environmental technologies.
Kew Gardens
- What science do they do at Kew?
The Royal Botanical Gardens at Kew is a vast organization with researchers stationed around the world. Around 700 scientists are employed by the organisation in total. The work is organized into research teams with certain objectives. For example, the Millennium Seed Bank Project team works to conserve endangered plant and fungal species, to promote educational awareness about the issue, to understand the potential values of plants, and to implement the sustainable agriculture of plants in areas that depend on them for their socio-economic well-being. Other teams include Madagascar, UK Overseas Territories, Mycology, Monocots III: Orchids, and Large-scale Syntheses to name a few. Kew scientists are a major part of new plant discoveries and plant research. One major task they undertake is sequencing plant DNA. In the Independent, Jonathan Owen wrote "Kew Scientists Lead Fight to Save Orchids from Extinction: Global Team to Freeze Seeds from 2,000 Species". If we lose plant species, we also potentially lose vast arrays of medicine, food, and a more stable environment. In the nursery at Kew, workers pollinate and preserve many plant species.
- What evidence of scientific underpinnings did you find in the displays?
The Order Garden displays plants by their order. All displays of plants and fungi listed their respective scientific names and their common names. Several displays had panels with a paragraph or two of information. These organized displays and educational panels provided evidence of the science behind the beautiful displays.
- Why is it important to society, that is why should society support the work Kew does?
Plant science is important to society for a variety of reasons. Some plants have natural healing properties. Other plants provide the missing information and properties that can help to cure chronic diseases such as cancer and HIV/AIDS. Flora and fungi are vitally important to the natural balance of Earth systems. Losing species could be disastrous to humanity, other living beings, and to the maintenance of an environment with the ability to maintain life. Kew also informs the public through their educational programs, tours, displays, and events. This fosters an appreciation for science, increases the amount of individuals who are scientifically literate and therefore more adept to support viable policy plans, and inspires further generations to become plant, fungi, and environmental scientists. A society that supports botanical research and conservation projects is a society that puts education at its forefront and gives itself the tools for further medical and environmental research.
- What are the principle near-term and long-term benefits that are likely to accrue from their work? Another way to ask this question is who benefits from their research and why?
People suffering from illnesses that do not yet have a complete cure or any cure at all benefit from the research on plants and fungi at Kew because certain plants have unknown beneficial properties. The plants and fungi lost that are threatened with extinction can be saved for future research. Knowledge itself is increased due to the lengths scientists go to understanding these living beings and researching the family connections they fall under. The general public increase their knowledge after attending the workshops, talks, and tours Kew holds regularly. Student groups benefit from learning new things, from seeing plants and fungi from around the world, and from gaining inspiration to undertake their own work in this field of science. Mirroring our architecture on the natural shapes and properties of plants and creating cities populated with many plants, fungi, humans, and other living things together helps create a healthier and longer-lasting biosphere for all.
Fibonacci at Kew
The Xstrata Treetop Walkway at Kew Gardens follows the Fibonacci sequence, a mathematical phenomenon that describes many natural growth patterns in nature. Basically, the numbers in the Fibonacci sequence is the sum of the two previous numbers. The sequence looks like this: 1, 1, 2, 3, 5, 8, 13, 21, 34, 55, 89, 144 and so on. There is a Fibonnacci grid along each walkway truss. The spacing of the diagonals on the truss is dictated by the sequence. Therefore, there is a higher construction density at the ends that carry the most weight. [IMG]http://i103.photobucket.com/albums/m148/mckayla34/Study%20Abroad%20in%20London%202011/DSCI02522.jpg[/IMG]
Technology and Sustainability Talk
On the 15th of February, I attended a lecture by Charlie Peck entitled "Technology and Sustainability, Oxymoron or Synergy?". The talk focused on the relationship between technology and environmental sustainability. Two main questions arose. First, does the further evolution of technology have an adverse effect on the health of the environment? Some examples of this include electronic waste, energy technology that pollutes the environment further, inefficient and fossil-fuel powered transportation, more complex and disjointed technologies, increased human dependency on technology and subsequent skill loss, an increased gap between the rich and the poor, more narcotics that cause more health harm and are more addictive than the current ones, a standard of living that takes more energy to sustain, and energy intensive technologies that become symbols of wealth and status. Second, can new technological developments serve to reduce the amount of CO2 in the atmosphere, clean and create fresh water without putting deadly chemicals in the environment, devise ways of transportation that do not rely on fossil fuels and are efficient, produce energy from sources that do not rely on fossil fuels, and increase the ability for people to communicate and organize. The talk was efficient in that it did not get caught up in the whether or not global warming is occurring debate. It focused on discussing the technologies that respond to changes in the environment and the technologies that can be adapted to human societies to make them more efficient. While organized in a logical manner, the strongest parts of the presentation were the graphs and illustrations of the main concepts. In particular, the graph that represented the disjointed way society adopts new technological developments such as the radio and the mobile phone was illuminating. It made me think about the relative speed of technological evolution and the time lapse society takes to adopt those developments. I also enjoyed the model of the electric car with regenerative braking. More diagrams would have served the lecture better. Also, adding animations to the power point would have helped. For example, many slides had a lot of text that the speaker talked about one-after-the-other. If the power point had only listed the point he was talking about when he was talking about it, I think people would have paid more attention because they would not have read ahead and then lost attention in what was a very informative talk. The hand-models the speaker used were very great at explaining main points. Overall, this was a talk that hit a lot of points, made me aware of new technologies that are working to move towards an environmentally sustainable urban society, alerted me to the problems of some technologies, and fit into the reduce-reuse-recycle model for environmental sustainability.
Perhaps there is room for a part two that addresses the feasibility of substantial change within a very limited infrastructure. For example, "Who Killed the Electric Car" is a film that questions why we have the technology to make this fantastic technology available to all but suddenly stopped hearing information about it. Because oil companies have the most profits and have the most lobbyists in government, it makes sense for them to not fund, not give television coverage to, and pay off scientists to not release new information. How far can we use the market to enact beneficial environmental change for all? Two other films of interest are "Zeitgeist" and "Zeitgeist: Addendum". This may get into a conspiracy talk, but we have to wake up and call on these companies to let go if we want the millions of people that are going to perish from decreased food yields in desert climates, intense storms, and extensive flooding to survive. Does economic profit trump communal human health and survival? This is another talk for another day.
Astronomy and the Cosmos
Astronomy:
-A star's ultimate defeat and, it could be argued, its final death occurs when the anti-gravitational force of its electrons can no longer sustain the strong gravitational pull of the star's center. The area then becomes a black hole. Because matter can neither be created nor destroyed, what, then, is a black hole?
-Is there an animation that illustrates the birth and death of a star?
-When the male feminist slam poet came to Earlham to perform, he told his audience about a new form of energy called nuclear fisson (or fusion) that he was studying at MIT. What is this and can we use this process to extract energy without damaging the environment?
-If the moon were to crash into the Earth (say we were developing expensive flats on its surface and the moon had structural failure) would the Earth decrease in size? This question comes from the statement that the moon was formed from an asteroid crashing onto its surface and getting rid of a lot of its material to form the moon.
Cosmos:
-Are the properties of anti-matter misrepresented by science fiction and new movies such as 'AstroBoy'? Mainly, these tales maintain that if matter and anti-matter come into contact, an atomic explosion capable of destroying our entire planet will occur. That seems silly if dark matter is more abundant in the universe than baryonic matter and both exist simultaneously. Are anti-matter and dark matter the same thing?
-Why did Einstein withdraw his cosmological constant theory? Does it not keep with the cosmological expansion finding by Hubble? If not, why? If so, how?
-Could you explain how the book explains time using minutes and seconds?
Vivian's Journal
First question.
- First response.
Second question.
- Second response.
