File list
Jump to navigation
Jump to search
This special page shows all uploaded files.
| Date | Name | Thumbnail | Size | Description | Versions |
|---|---|---|---|---|---|
| 03:15, 8 December 2011 | Picture11.jpg (file) |  |
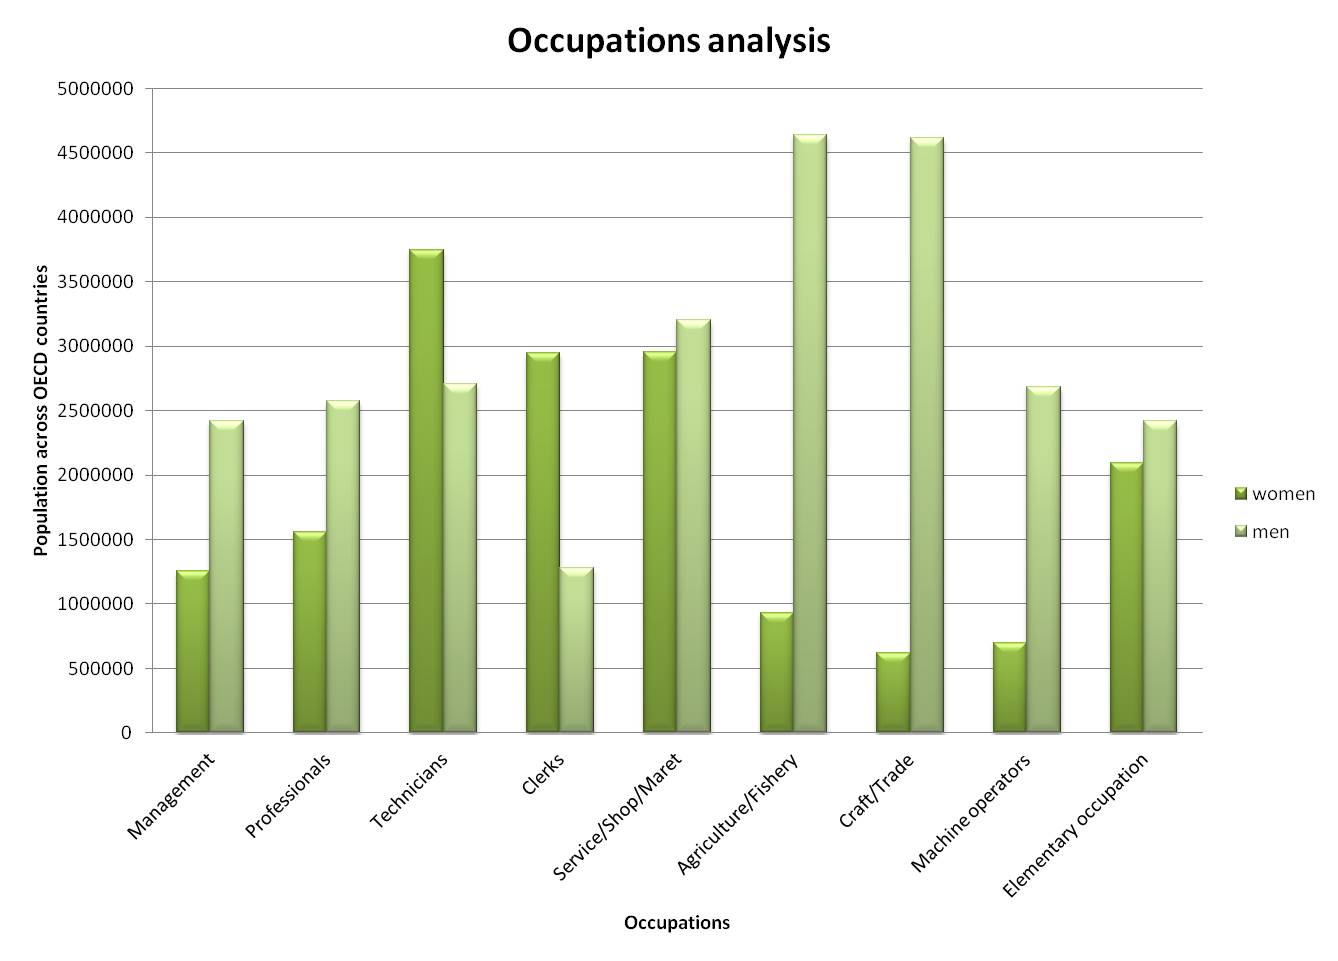
86 KB | Number of men in the occupation fields vs number of women taking the same work positions | 1 |
| 03:12, 8 December 2011 | Picture8.jpg (file) |  |
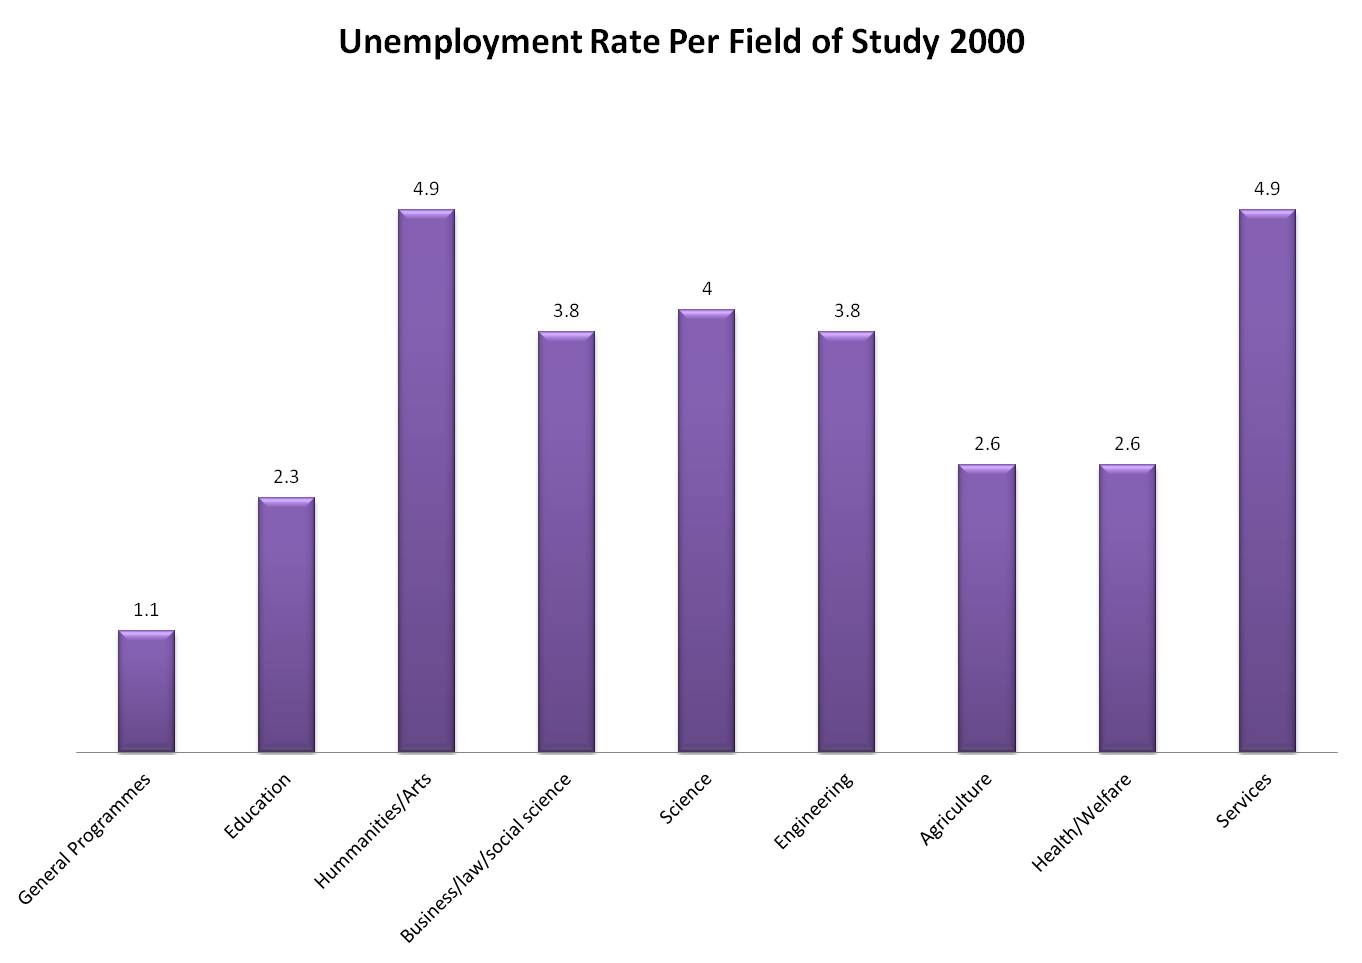
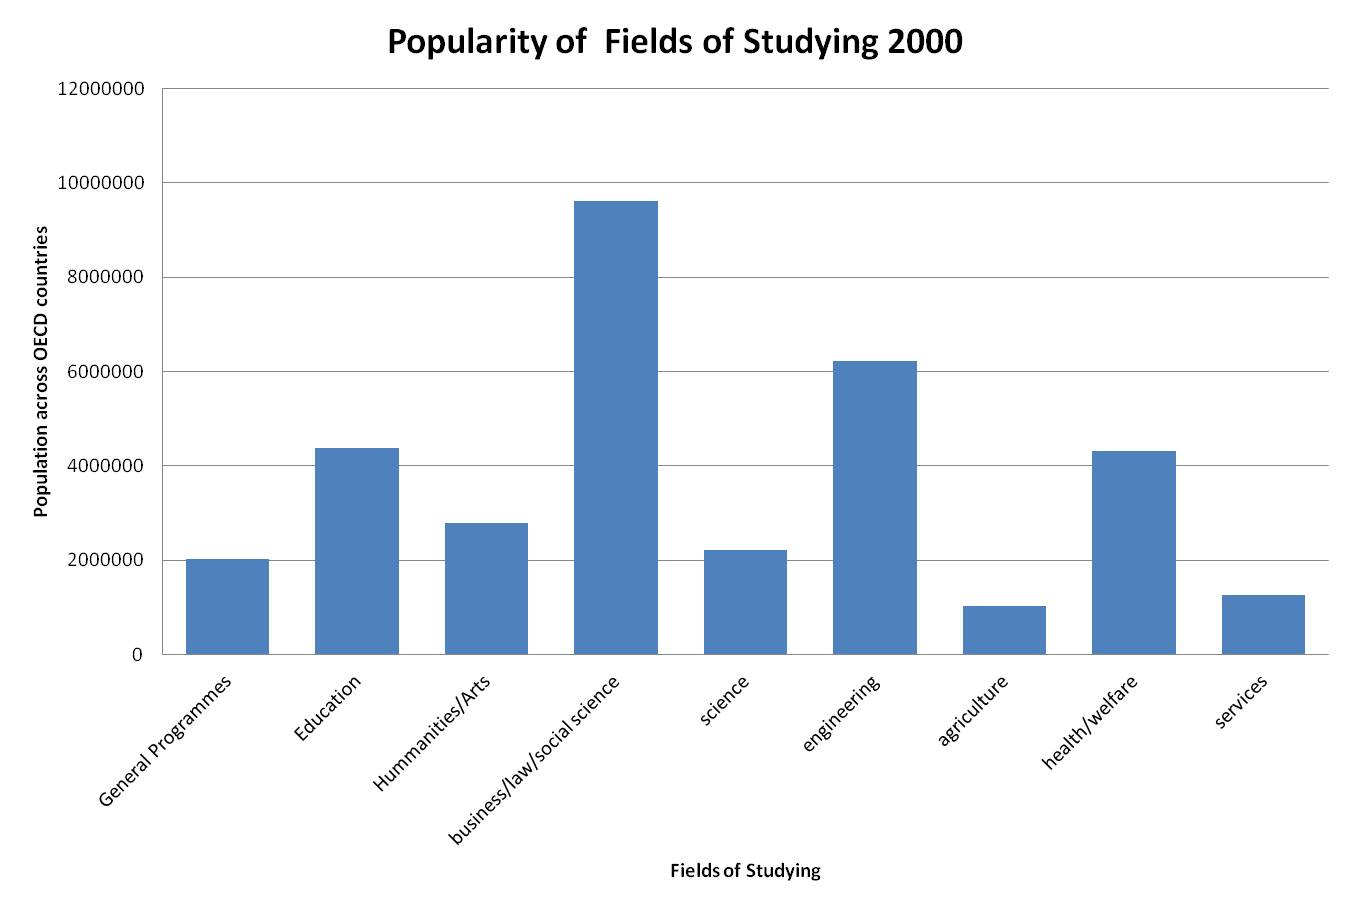
61 KB | My next step was to compare the popularity of fields of study and how many people with the particular field were currently unemployed (graph 7 - 8). | 1 |
| 03:11, 8 December 2011 | Picture10.jpg (file) |  |
66 KB | My next step was to compare the popularity of fields of study and how many people with the particular field were currently unemployed (graph 7 - 8). | 1 |
| 03:07, 8 December 2011 | Picture6.jpg (file) |  |
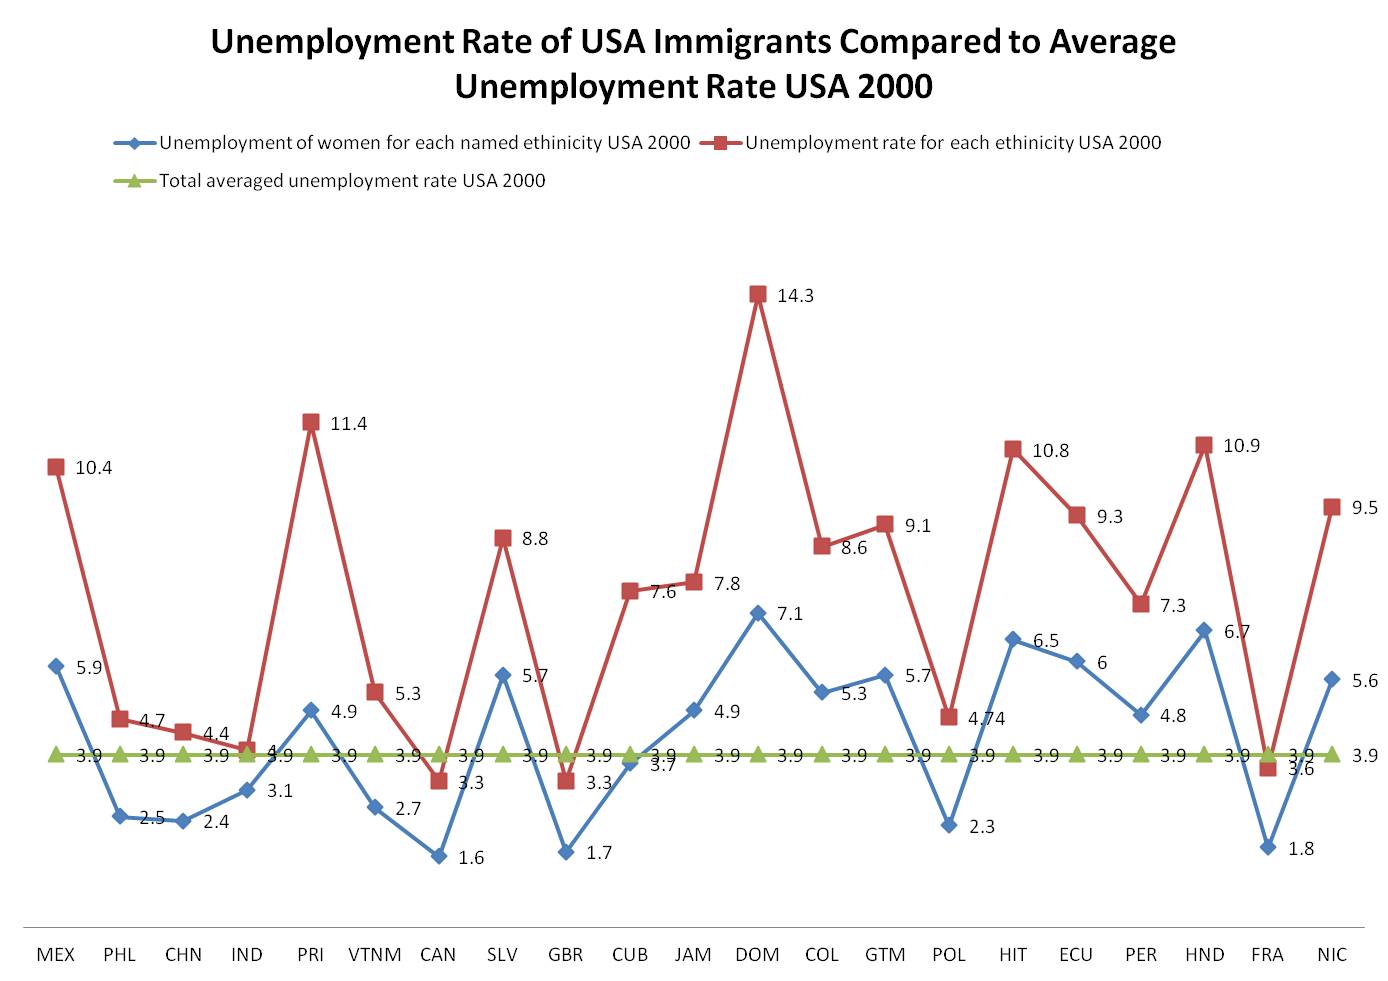
108 KB | Compared unemployment rates for each of the immigrants' populations in USA, females of different nations, and average USA unemplyment rate for the year 2000. | 1 |
| 02:59, 8 December 2011 | Picture5.jpg (file) |  |
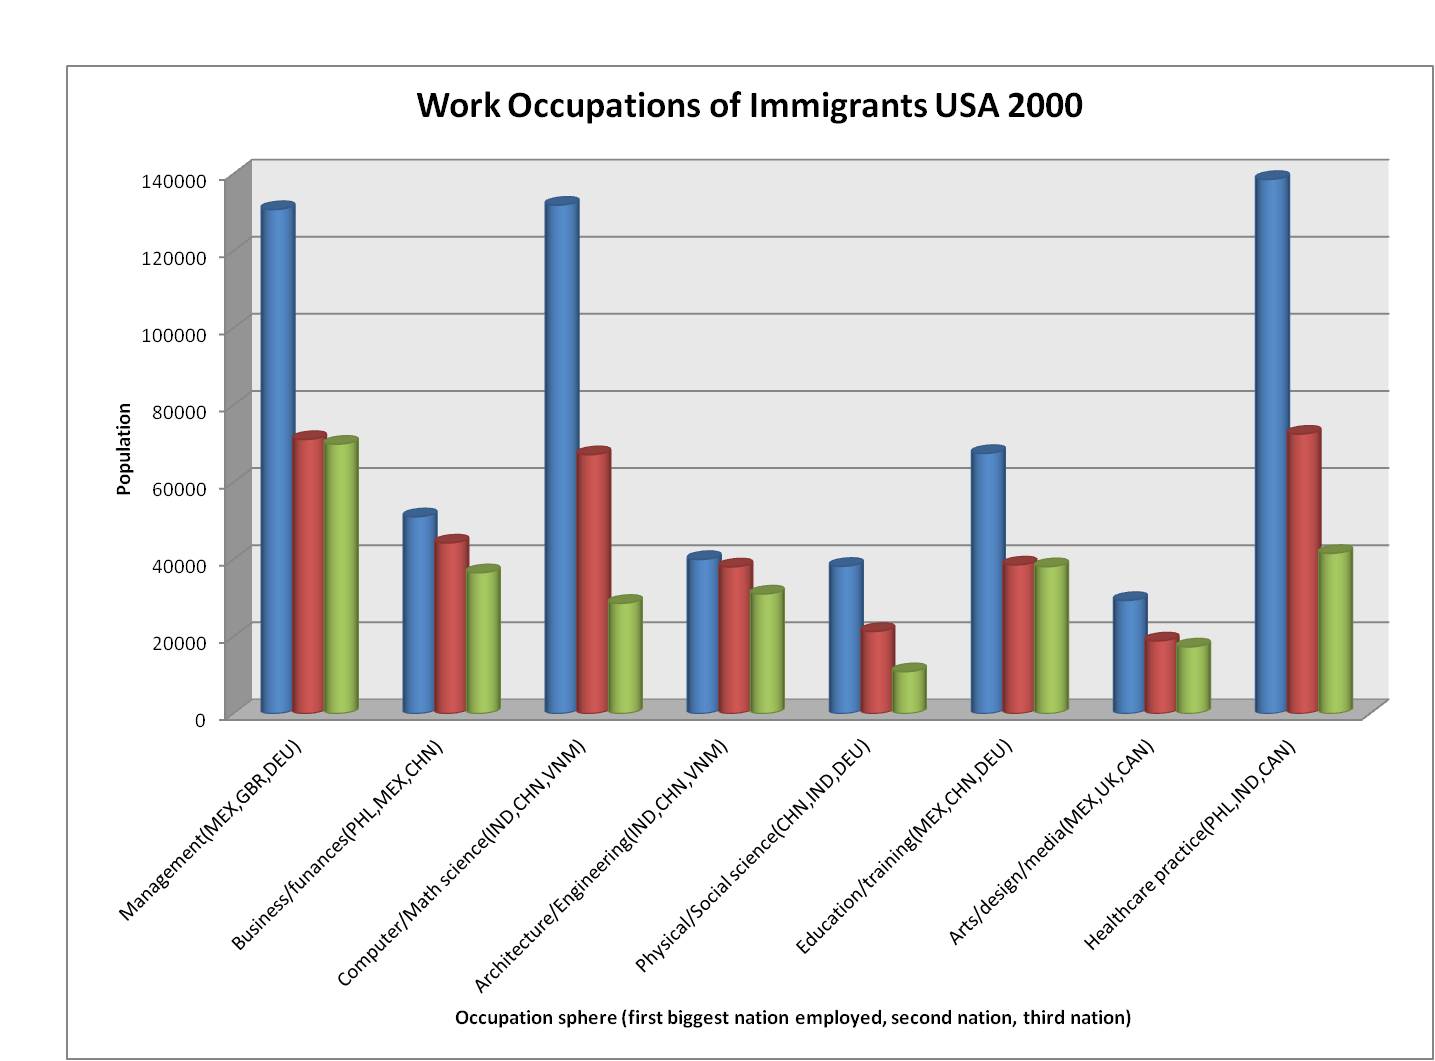
110 KB | I referred again at USA profile and established which professions get occupied the most by which immigrants (graph 5). | 1 |
| 02:38, 8 December 2011 | Picture4.jpg (file) |  |
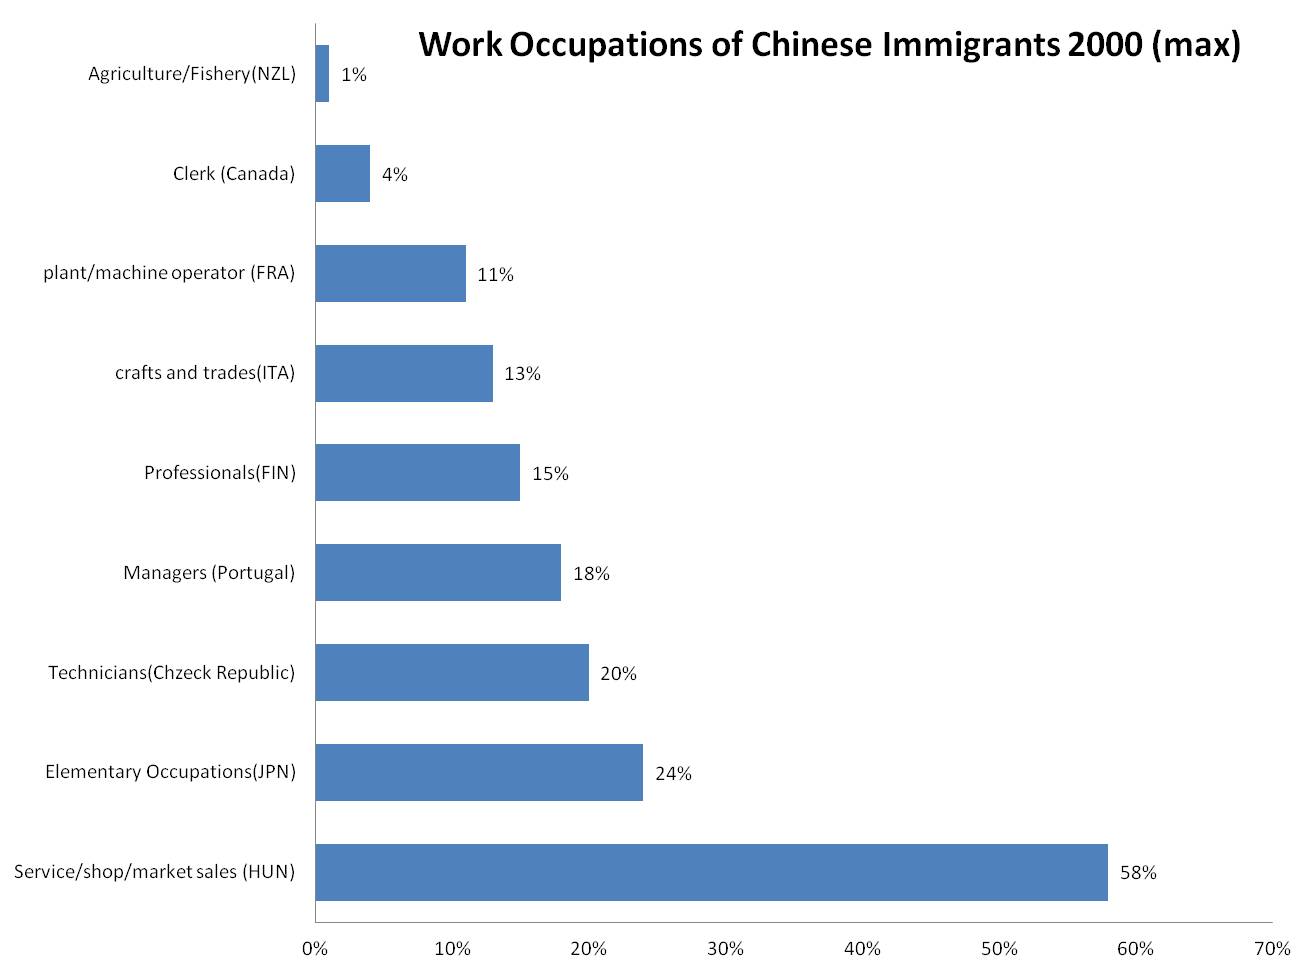
64 KB | I decided to focus on specifically one nation (Chinese) and determine which work positions they tempt to work most of all and in which countries (from the given OECD range). I particularly wanted to see if preferences for one occupation varied from other | 1 |
| 02:27, 8 December 2011 | Picture3.jpg (file) |  |
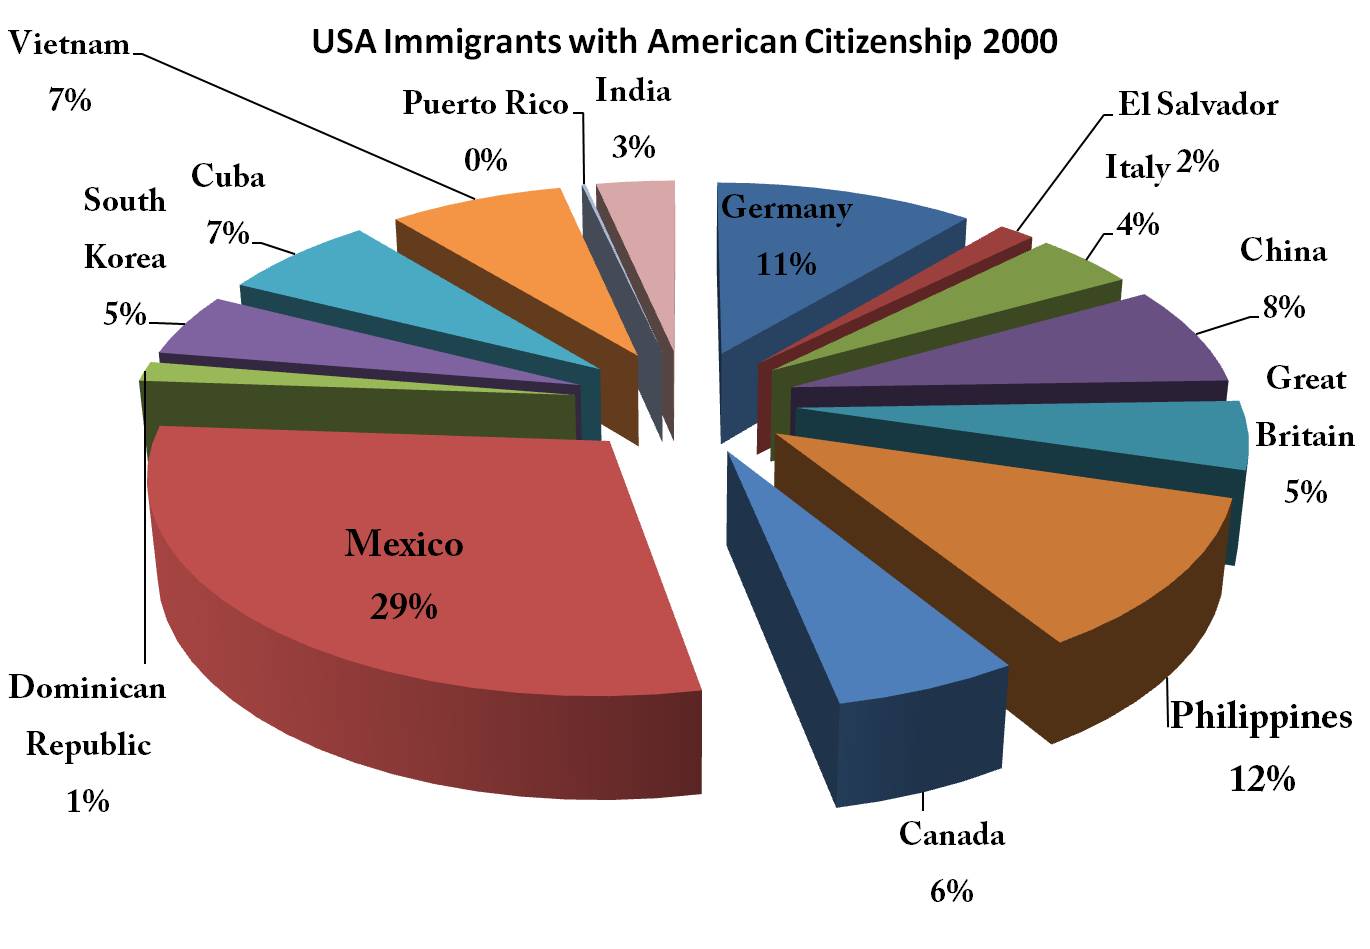
92 KB | Shows how many of the immigrants obtained US citizenship | 1 |
| 02:19, 8 December 2011 | Picture2.jpg (file) |  |
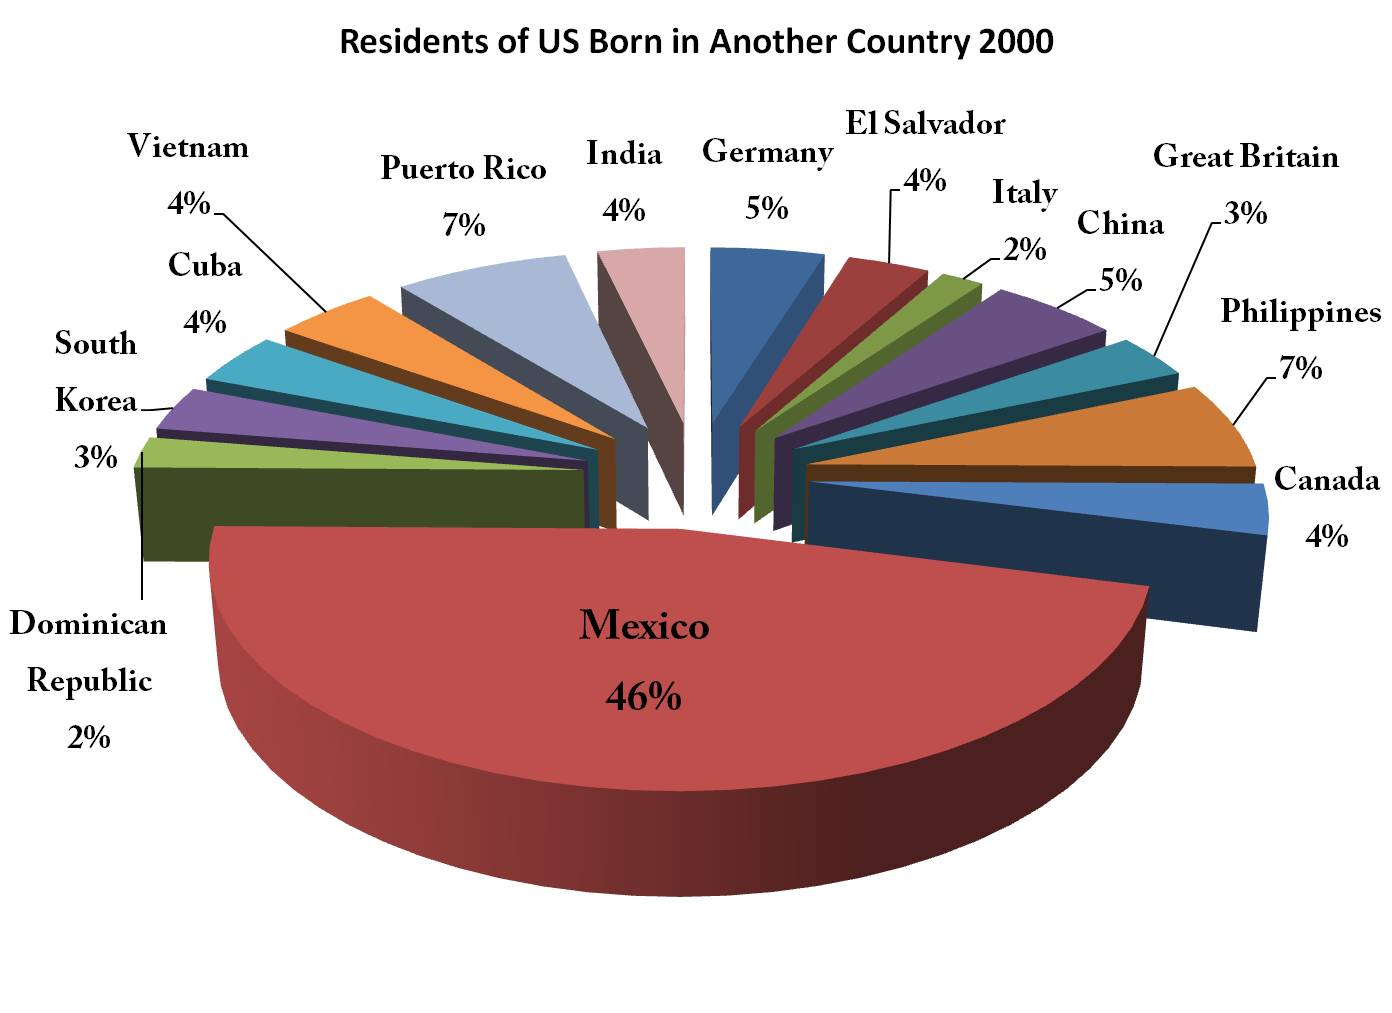
90 KB | The graph shows where the majority of immigrants come from. | 1 |
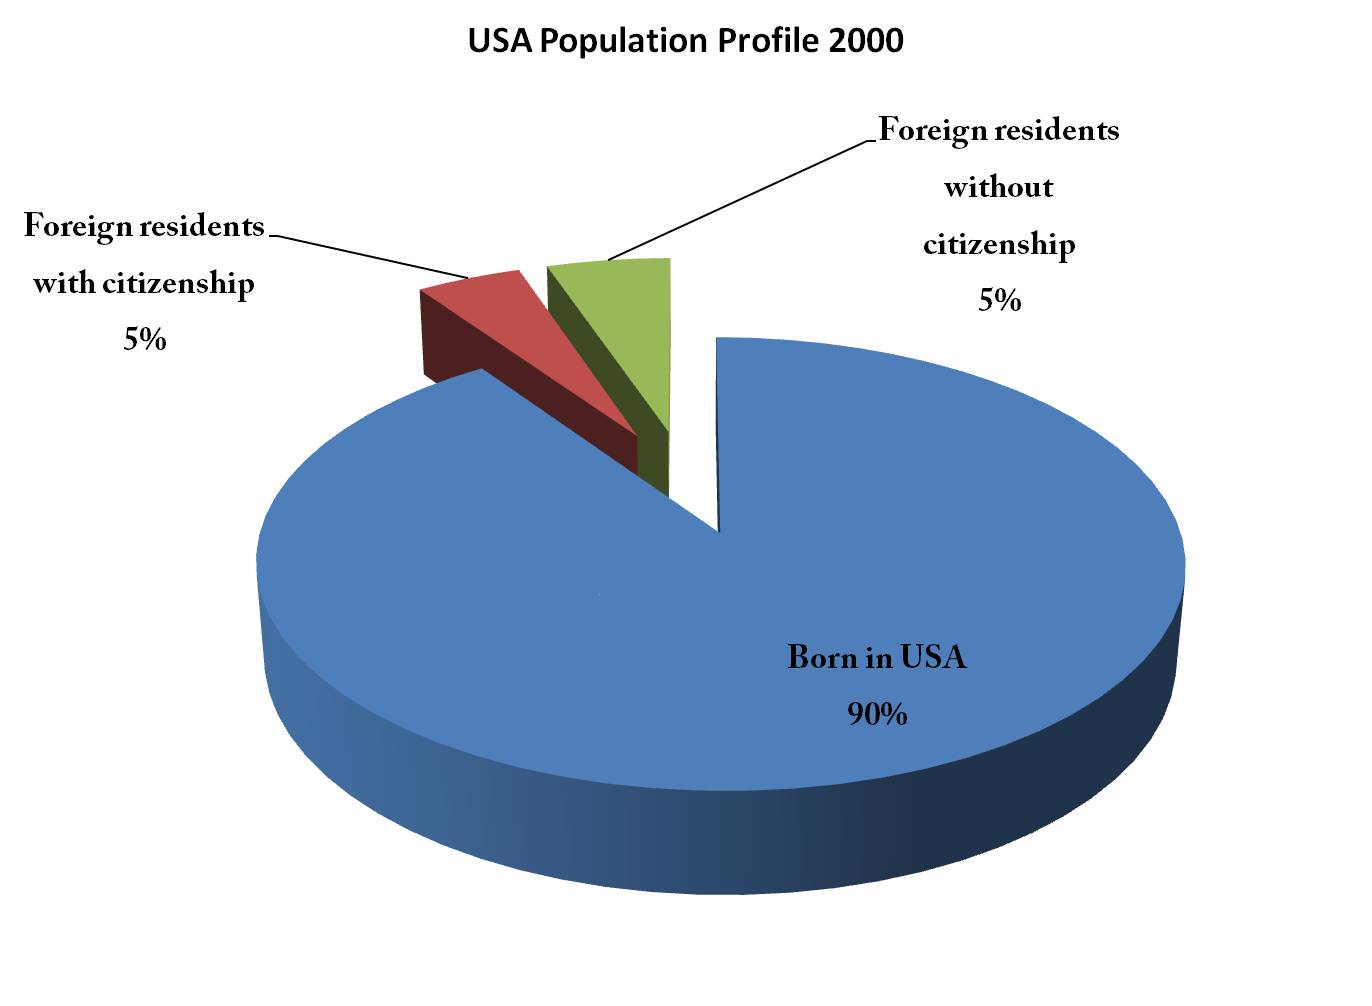
| 02:05, 8 December 2011 | Pop prof1.jpg (file) |  |
55 KB | USA population profile | 1 |
| 01:56, 8 December 2011 | Picture1.jpg (file) |  |
55 KB | 1 |