HIP:Mashup
Jump to navigation
Jump to search
Getting to the final mashup
This is an easy step by step procedure for converting data collected by sonde into the YSI 650 MDS and transfered into a computer to the pictures as seen below.
The following is an example of data from sonde, which has been converted to a csv file using EcoWatch.
"Date","Time","Temp","SpCond","Cond","Resistivity","pH","ORP","Longitude","Latitude"
"M/D/Y","hh:mm:ss","C","uS/cm","uS/cm","Ohm.cm","","mV","DD.dddd","DD.dddd"
"05/25/09","11:20:54",23.13,614.0,592.0,1688.4,8.98,145,-84.899391,39.848564
"05/25/09","11:21:04",23.14,616.0,594.0,1682.3,8.97,24,-84.899391,39.848560
"05/25/09","11:21:14",23.16,618.0,596.0,1677.6,8.92,10,-84.899406,39.848568
"05/25/09","11:21:24",23.23,616.0,596.0,1679.0,9.13,-8,-84.899414,39.848614
"05/25/09","11:21:34",23.30,615.0,595.0,1682.0,9.71,-3,-84.899445,39.848648
"05/25/09","11:21:44",23.31,614.0,594.0,1682.8,10.10,7,-84.899544,39.848686
"05/25/09","11:21:54",23.29,614.0,594.0,1683.5,10.28,14,-84.899628,39.848701
"05/25/09","11:22:04",23.21,615.0,594.0,1684.6,10.37,20,-84.899734,39.848736
"05/25/09","11:22:14",23.14,617.0,595.0,1681.2,10.38,24,-84.899818,39.848812
"05/25/09","11:22:24",23.09,617.0,595.0,1680.9,10.41,28,-84.899948,39.848873
"05/25/09","11:22:34",23.01,620.0,596.0,1677.1,10.39,32,-84.900017,39.848980
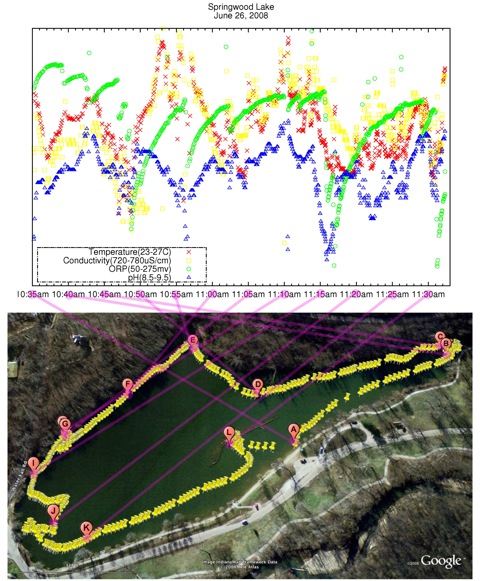
The final product from the cvs file is presented as the pictures below, which was produced from a combination of google earth, GNUplot and GNU Image Manipulation Program (GIMP).
- GNUplot which is used to get the graph is installed in all the ACLs and in stewie, and hence you don't have to install to use it.
- To make the graph, go to the directory where you have you data file (which will be a csv file if it was generated by EcoWatch.
- type gnuplot and return, then you will be on gnuplot.
- To plot the data file type 'load "file name"'
.
