Difference between revisions of "Ivan-cs488-paper"
(→Geocoded data) |
(→Geocoded data) |
||
| Line 35: | Line 35: | ||
My inexpensive and portable platform aims to remove friction related to extremely steep learning time curve (which is not useful) for every individual monitoring device, their operating systems and variety of different data ?les they generate. The entire project is going to be part of the open source community which will make it easy for everybody to integrate any other sensor with USB interface in to this system. | My inexpensive and portable platform aims to remove friction related to extremely steep learning time curve (which is not useful) for every individual monitoring device, their operating systems and variety of different data ?les they generate. The entire project is going to be part of the open source community which will make it easy for everybody to integrate any other sensor with USB interface in to this system. | ||
| − | [[File:Filemoze.png| | + | [[File:Filemoze.png|1200px|thumb|left|alt=Algorithm No1|Algorithm No1]] |
Revision as of 07:40, 28 November 2012
Inexpensive, portable and expendable open source environmental monitoring platform with integrated geocoding
Contents
Abstract
The aim of my senior project is to create an inexpensive and portable platform for environmental monitoring sensors. In order to achieve this goal, my paper will deeply explore both hardware and open source software solutions with a final goal of creating a simple monitoring platform consisting of one environmental sensor and a frame support software. A very strong emphasis will be placed on integrated advanced geocoding of data for any sensor reading conducted by this monitoring platform.
Introduction
Everything our civilization have learned so far about the great planet we all live in is mainly coming from observing and monitoring the environment around us. Understanding how our planet works and predicting its behavior is very important and one of the underlying ideas of modern science. In order to implement successful experiments and observations, a complete understanding of complicated environment sensors/instruments is crucial. I personally believe that complexity of monitoring sensors devices such as different operating systems, variety unstandardized data formats they generate and particularly high cost are creating significant friction for many ?eld scientist (mainly Biologists, Chemists, Geologists, Physicists and Environmental Scientists) to do the actual science.
My inexpensive and portable platform aims to remove friction related to extremely steep learning time curve (which is not useful) for every individual monitoring device, their operating systems and variety of different data ?les they generate. The entire project is going to be part of the open source community which will make it easy for everybody to integrate any other sensor with USB interface in to this system.
Main reason for high cost of monitoring devices
A simple water quality meeter, with closed software, inability to add any other sensor probe to it and without any possibility of directly geocoding collected data costs around $2,500. If we are planing to monitor water, air and soil the total device cost will add up close to $8,000. Taking in consideration the fact that none of those devices is able to geocode generated data, we have to add jet another device, a Global Positioning System (GPS). Having four different monitoring platforms, dealing with inconsistency in their underlying architectures, operating systems and geocodeless readings they generate is more than inconvenient and extremely expensive.
The problem is more than obvious, every sensor has its unique computer platform attached to it whose main job is to communicate with a sensor probe and take readings from it. In the case of water quality meeter, platform to where water probe is connected costs 5 times more than probe itself. Cost is high because every basic computer platforms has its screen, memory, battery...
Solution
The easiest way to significantly reduce the cost of monitoring devices it to have one platform with one battery, one screen and one memory capable of accepting variety of different sensor probes such as water, air and soil quality probes.
My plan is to use an Android Nexus 7 whose cost is $199,0 for base platform. The main reason behind this decision is its low cost, integrated GPS device (Integrated Monolithic GPS Receiver - BCM4751) as well as few more sensors (Gyro sensor, Magnetometer, Accelerometer), well documented USB interface, quad-core processor, open source operating system and great reputation and reviews.
My research showed that stand alone USB water, air and soil probes are available on market and their costs vary from $100 to $500.
Geocoded data
Everything our civilization have learned so far about the great planet we all live in is mainly coming from observing and monitoring the environment around us. Understanding how our planet works and predicting its behavior is very important and one of the underlying ideas of modern science. In order to implement successful experiments and observations, a complete understanding of complicated environment sensors/instruments is crucial. I personally believe that complexity of monitoring sensors devices such as different operating systems, variety unstandardized data formats they generate and particularly high cost are creating significant friction for many field scientist (mainly Biologists, Chemists, Geologists, Physicists and Environmental Scientists) to do the actual science.
My inexpensive and portable platform aims to remove friction related to extremely steep learning time curve (which is not useful) for every individual monitoring device, their operating systems and variety of different data ?les they generate. The entire project is going to be part of the open source community which will make it easy for everybody to integrate any other sensor with USB interface in to this system.
As we can see on the algorithm diagram, everything starts with the button Collect which will take three reading of latitude and longitude, average them up and store one final value in csv file column number 1 and 2. Once this process is complete, three reading of altitude will be taken and average will be stored in the csv file in column number 3. Furthermore, column number 4 will be populated with magnetic field data. The date and time will be stored in the column number 5 and 6. This part is going to happen every time one press the collect button regardless of which sensor probe is plugged to the monitoring platform. The column number 7 will have a unique key which will correspond to the person who is currently using the monitoring platform. The cvs column number 8 will contain name and the ID of the device (water, air, soil, temperature...) and after column 8 other instances of data will contain specific parameters generated by different probes. In the case of Yocto-Meteo, the output will look like this.
After pressing Collect, this output should be stored to memory: 39.82427190, -84.91212248, 299, 334-834, 10.26.2012, 2:25, IvanBabic001688412, Yocto-Meteo-1001, 16, 34, 90
This is how unique keys are matching with csv values:
| Latitude | Longitude | Altitude | Magnetic Field | Date | Time | Collectors ID | Device ID | Temperature | Humidity | Presure |
|---|---|---|---|---|---|---|---|---|---|---|
| 39.82427190 | -84.91212248 | 299 | 334-834 | 10.26.2012 | 2:25 | IvanBabic001688412 | Yocto-Meteo-1001 | 16 | 34 | 90 |
Base sensor
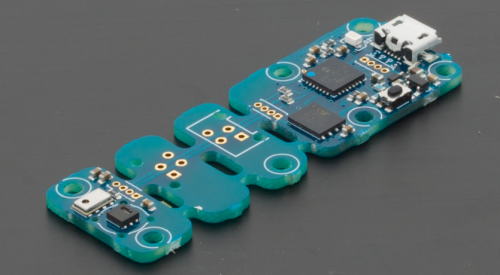
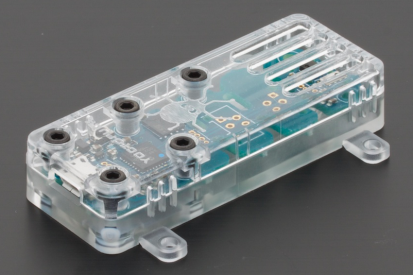
My sample sensor will be Yocto-Meteo, a device developed in Switzerland capable of measuring via USB the current humidity, pressure, and temperature. Designer of this product claims that device has accuracy of 0.3°C for temperature, about 4% for the humidity rate, and 1mbar for the atmospheric pressure (my personal test of precision and accuracy of Yocto-Meteo will be documented in 5.1). Furthermore, Yocto-Meteo has integrated data logger capable of recording data on its internal flash for later retrieval when connected again by USB (this function wont be used for my preliminary device test stage).
Validating of sensors precision and accuracy
Sensors precision and accuracy is the most important factor of any research. I am using temperature probe as my first sensor because I have the ability to test both its precision and accuracy.
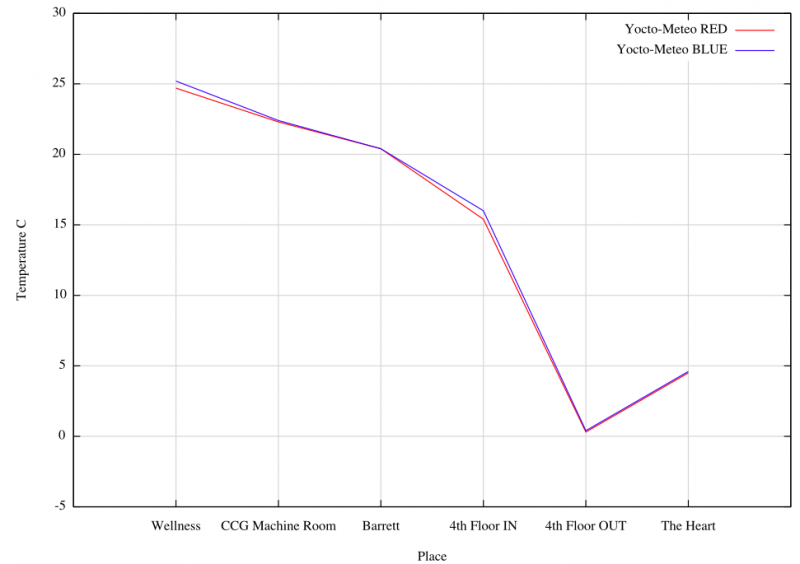
The best way to check devices precision is to have multiple Yocto-Meteo devices, put them in the same environment and record their data at the same time. Based in this, I went to 6 different environments on campus whose temperature varies greatly. Place where I took measurements are as follow: Wellness Center, The Heart, 4th Floor Out, 4th Floor In, CCG Machine Room and Barrette.
Based on this graph, we can conclude that Yocto-Meter are very precise because 2 of them have almost the same measurements.
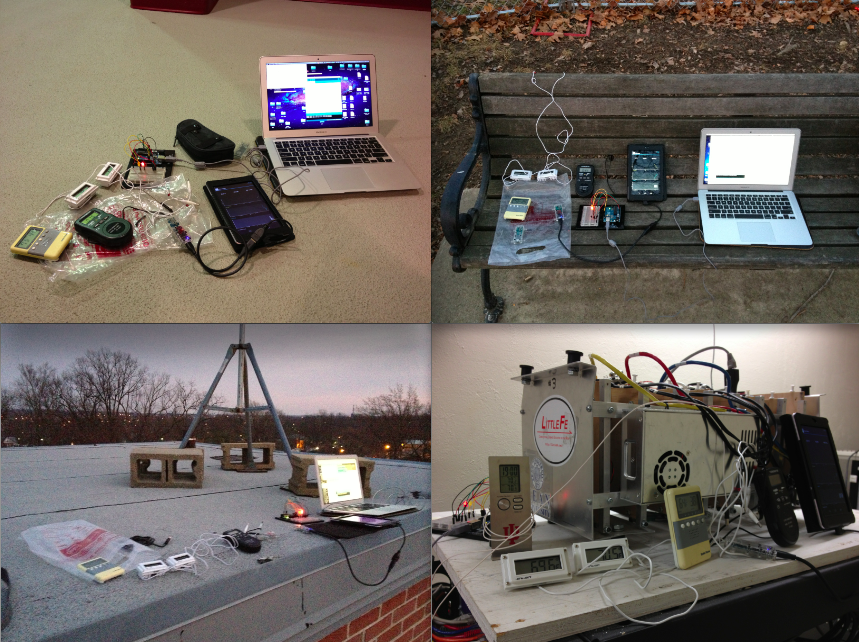
One of the ways to check accuracy is to use multiple different thermometers, place them in the same environment, take readings at the same time and compare them to Yocto-Meteo readings.
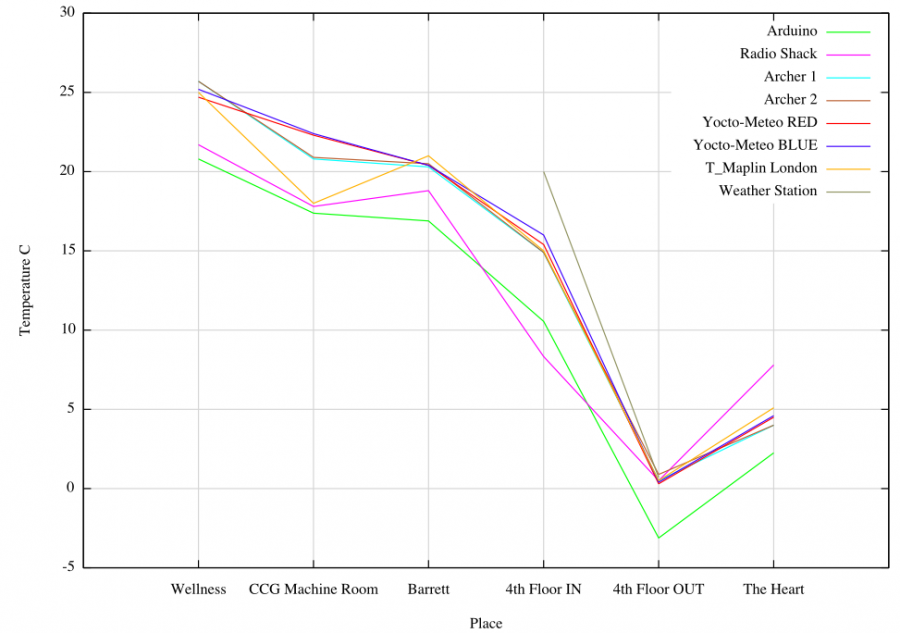
For the purpose of this experiment, I have used 8 individual termometers and record their values at the same time. The following picture demonstrates my set up of all 8 devices.
This graph shows all 8 termometers and we can see that values are very close. The biggest difference in the graph is by Arduino set up, one of the reasons for this could be a low end thermometer.
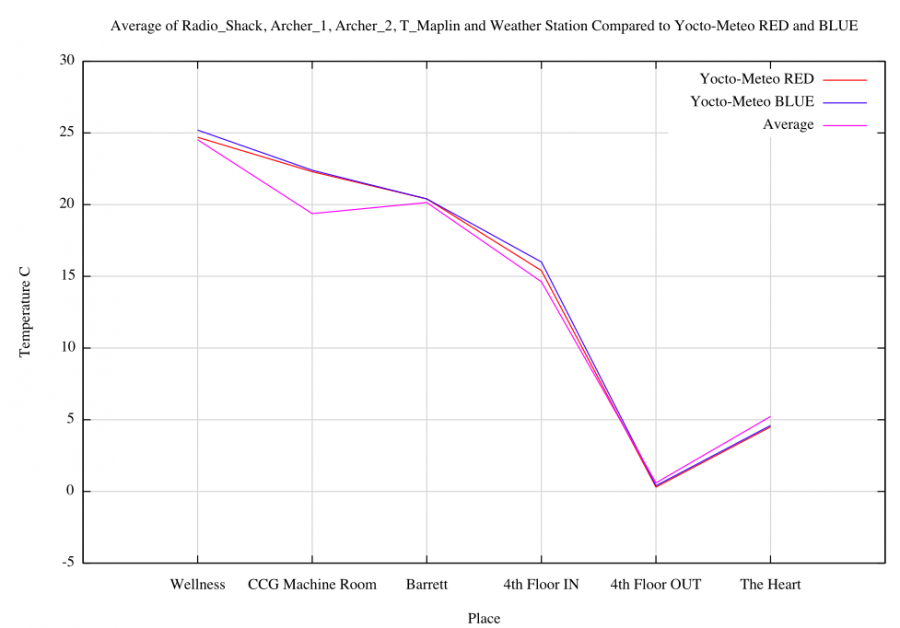
Purple line shows average of all termometers other than Arduino (because of its deflection from all other devices) and Yocto-Meteo RED and BLUE. This graph is a prof that Yocto-Meteor devices are vert accurate because their line is almost identical to average of other 6 thermometers.
Software functionality
- Launch Application
- Enter your ID: First, Last name and student ID
- Press "Collect"
- Record Latitude, Longitude and Altitude (3 fields in cvs)
- Record Magnetic Reading (1 field in csv)
- Record Date and Time (2 fields in csv)
- Record ID (1 field in csv)
- if sensor detected
- Record name and ID of sensor
- if Yocto-Meteo
- Record temperature, humidity and pressure values (3 fields in csv)
- if x Sensor
- Record x (x fields in scv)
- if Yocto-Meteo
- Move to another line in cvs file
- Record name and ID of sensor
- Move to another line in cvs file
Other functionalities:
- Take a look at the cvs file
- Upload a cvs file to MicroFe which will visualize it in Gnuplot
Visualization
Timeline
- Done:
- Create android development platform (software chain)
- Make a simple Hello World android application
- Make an application that will read latitude and longitude
- Learn about different sensors
- Decide which sensor to use first
- Contact people from Yoctopus about their sensor
- Contact people from water sensor company
- Learn more about USB and its way of communication
- Learning more abut Yocto-Meteo
- Testing its accuracy and precision
- Document its capabilities, max and mins and error
- Working on now:
- Figuring out the shape of graph output (final product)
- To do soon:
- Add altitude, # of satellites, precision, time and date to the application
- Figure out how to make android device communicate with sensor probe
- Make application store data in to the csv file (together with geocoded info) every time collect button is pressed
- Create an option allowing upload of collected data to another server or cloud
- Create a changeable timer that will initiate collect button every x minutes
- Design s simple web interface using tool such as Gnuplot to automatically visualize uploaded temperature data
- Note to myself, learn how to spell without spellchecker, one day you might use paper again...

