Difference between revisions of "Elena-big-data"
| Line 11: | Line 11: | ||
*Load the data into your Postgres instance: | *Load the data into your Postgres instance: | ||
Example of creating a table: | Example of creating a table: | ||
| − | + | create table citizenship_age (country char(5),coub char(10),fborn int, edu_lfs int, edu_cen int, age_lfs int, age_cen int, nat int, number int, reg_oecd int, reg_regions char(30)); | |
The used command for import is: | The used command for import is: | ||
| − | + | copy citizenship_age from '/path/to/the/file/FILE.csv DELIMITER ',' CSV; | |
*Develop queries to explore your ideas in the data | *Develop queries to explore your ideas in the data | ||
These are the examples of some of the queries I used to investigate different areas of my analysis | These are the examples of some of the queries I used to investigate different areas of my analysis | ||
Viewing total immigrants' population in USA, sorted by the country of birth: | Viewing total immigrants' population in USA, sorted by the country of birth: | ||
| − | SELECT coub, | + | SELECT coub, sum(number) from (select * from citizenship_age where country='USA' and fborn=1) as p1 group by coub; |
Determening where in world Chinese immigrants work the most as managers (as an example). The returned result for each of the positions was further divided by the total Chinese immigrant's population of that country in order to get comparable ratio. | Determening where in world Chinese immigrants work the most as managers (as an example). The returned result for each of the positions was further divided by the total Chinese immigrant's population of that country in order to get comparable ratio. | ||
| − | + | select country,occupation,sum(number) from occupations where fborn=1 and coub='CHN' and occupation>='10' and occupation<'20' group by country, occupation; | |
Determening immigrants of which country occupy work in business (as an example) more than others in USA. | Determening immigrants of which country occupy work in business (as an example) more than others in USA. | ||
| − | + | select coub,sum(number) from occupations where country='USA' and occupation='USA_02' and fborn=1 group by occupation,coub; | |
Looking at unemployed femail immigrant population in USA. Later the result for each of the nation was divided by the total employed femaile population of that nation in USA. | Looking at unemployed femail immigrant population in USA. Later the result for each of the nation was divided by the total employed femaile population of that nation in USA. | ||
| − | + | select country,coub,sum(number) from labour_status where fborn=1 and lfs_lfs=2 and and sex=2 and country='USA' group by country,coub; | |
Viewing how many people of the particular field of study are unemployed | Viewing how many people of the particular field of study are unemployed | ||
| − | + | select sum(number) from fields_study where field_edu=1 and lfs_lfs!=1; | |
| − | Viewing overall population of femails that work in agriculture (as | + | Viewing overall population of femails that work in agriculture (as example) |
| − | + | select max(sum) from (select coub,sum(number) from occuations where occupation>='60' and occupation<'70' and sex=2 group by coub) as p1; | |
*Develop and document the model function you are exploring in the data | *Develop and document the model function you are exploring in the data | ||
*Develop a visualization to show the model/patterns in the data | *Develop a visualization to show the model/patterns in the data | ||
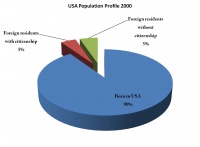
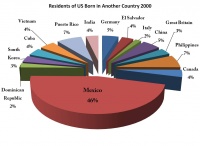
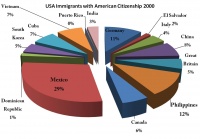
| − | The following 3 graphs | + | The following 3 graphs were used to recreate USA population profile. From the first graph, it is visible that 10% of USA population are people born outside of US, 5 % of which obtained USA citizenship.The second shows where most of the immigrants come from, and the third - how many of those immigrants obtained USA citizenship. |
| − | [[File: | + | [[File:pop_prof1.jpg|200px|thumb|left|alt text]] |
| + | [[File:Picture2.jpg|200px|thumb|left|alt text]] | ||
| + | [[File:Picture3.jpg|200px|thumb|left|alt text]] | ||
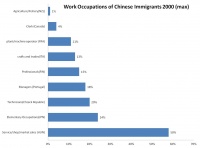
| + | Next, I decided to focus on specifically one nation and determine which work positions they tempt to work most of all and in which countries (from the given OECD range). I particularly wanted to see if preferences for one occupation varied from other one, and weather some countries were used more that once. | ||
| + | [[File:Picture4.jpg|200px|thumb|left|alt text]] | ||
| + | |||
===== Tech Details ===== | ===== Tech Details ===== | ||
* Node: as5 | * Node: as5 | ||
Revision as of 02:44, 8 December 2011
- Title: Stereotypes Through Statistics
- Dataset used: A Profile of Immigrant Population in the 21st century in OECD Countries
- Aims and Ideas: Having a dataset about immigrants' population, I had a chance to create different population profiles, with the aim to verify and/or disprove certain stereotypical knowledge about the immigrants, as well as different nations. This includes me looking at occupations, countries of birth and labour force status.
- Complications: Unfortunatly, my data didn't include any unique identifiers, which made it hard to work with the dataset, as well as made it not possible to answer some of wanted queries. Also, data didn't have range of years, which limited me in the ways of exploring the data. When viewing my results, please, keep in mind that the data was collected for the year 2000, and is limited only for OECD countries.
Project Tasks
- Identifying and downloading the target data set
The dataset can be downloaded from here: http://www.oecd.org/document/51/0,3746,en_2649_33931_40644339_1_1_1_1,00.html
- Data cleaning and pre-processing:
Data is in CSV format. I had to illuminate few charcters. I erased ^M by using dos2unix file1 > file2 command
- Load the data into your Postgres instance:
Example of creating a table:
create table citizenship_age (country char(5),coub char(10),fborn int, edu_lfs int, edu_cen int, age_lfs int, age_cen int, nat int, number int, reg_oecd int, reg_regions char(30));
The used command for import is:
copy citizenship_age from '/path/to/the/file/FILE.csv DELIMITER ',' CSV;
- Develop queries to explore your ideas in the data
These are the examples of some of the queries I used to investigate different areas of my analysis Viewing total immigrants' population in USA, sorted by the country of birth:
SELECT coub, sum(number) from (select * from citizenship_age where country='USA' and fborn=1) as p1 group by coub;
Determening where in world Chinese immigrants work the most as managers (as an example). The returned result for each of the positions was further divided by the total Chinese immigrant's population of that country in order to get comparable ratio.
select country,occupation,sum(number) from occupations where fborn=1 and coub='CHN' and occupation>='10' and occupation<'20' group by country, occupation;
Determening immigrants of which country occupy work in business (as an example) more than others in USA.
select coub,sum(number) from occupations where country='USA' and occupation='USA_02' and fborn=1 group by occupation,coub;
Looking at unemployed femail immigrant population in USA. Later the result for each of the nation was divided by the total employed femaile population of that nation in USA.
select country,coub,sum(number) from labour_status where fborn=1 and lfs_lfs=2 and and sex=2 and country='USA' group by country,coub;
Viewing how many people of the particular field of study are unemployed
select sum(number) from fields_study where field_edu=1 and lfs_lfs!=1;
Viewing overall population of femails that work in agriculture (as example)
select max(sum) from (select coub,sum(number) from occuations where occupation>='60' and occupation<'70' and sex=2 group by coub) as p1;
- Develop and document the model function you are exploring in the data
- Develop a visualization to show the model/patterns in the data
The following 3 graphs were used to recreate USA population profile. From the first graph, it is visible that 10% of USA population are people born outside of US, 5 % of which obtained USA citizenship.The second shows where most of the immigrants come from, and the third - how many of those immigrants obtained USA citizenship.
Next, I decided to focus on specifically one nation and determine which work positions they tempt to work most of all and in which countries (from the given OECD range). I particularly wanted to see if preferences for one occupation varied from other one, and weather some countries were used more that once.
Tech Details
- Node: as5
- Path to storage space: /scratch/big-data/elena
Results
- The visualization(s)
- The story


