Difference between revisions of "England-2011-lab2-green"
(→Images) |
(→Appendix C: Who Did What) |
||
| (12 intermediate revisions by 3 users not shown) | |||
| Line 7: | Line 7: | ||
For this lab, Dr. Obsfucation sent out eleven photographs of various bodies of water around central London. He informed us that Penelope Poison was threatening to release toxic substances at each location; he asked the Green Team to find each location using the photographs and take several readings at each location: longitude, latitude, elevation, wind direction, wind speed, water temperature, and air temperature. More importantly, for every reading it was necessary that we take three readings in order to make an accurate measurement. | For this lab, Dr. Obsfucation sent out eleven photographs of various bodies of water around central London. He informed us that Penelope Poison was threatening to release toxic substances at each location; he asked the Green Team to find each location using the photographs and take several readings at each location: longitude, latitude, elevation, wind direction, wind speed, water temperature, and air temperature. More importantly, for every reading it was necessary that we take three readings in order to make an accurate measurement. | ||
| − | Our initial approach dealt with using the geo-coding of each photograph to identify the longitude and latitude and then map out the locations. The photos were downloaded and imported into iPhoto, where the "Places" application created a map of the locations. With a time element involved, we decided to head towards Regents Park first, where two photographs were taken, and make our way back Trafalgar Square, via Hyde Park and then Green Park / St. James Park. The methodology for the collection of necessary data is explained below. | + | Our initial approach dealt with using the geo-coding of each photograph to identify the longitude and latitude and then map out the locations. The photos were downloaded and imported into iPhoto, where the "Places" application created a map of the locations. With a time element involved, we decided to head towards Regents Park first, where two photographs were taken, and make our way back to Trafalgar Square, via Hyde Park and then Green Park / St. James Park. The methodology for the collection of necessary data is explained below. |
== Data Collection == | == Data Collection == | ||
| Line 125: | Line 125: | ||
|} | |} | ||
| + | |||
| + | The air temperatures between our locations did not vary much they were all low temperatures with a range of 31°F-34°F. Due to this Penelope Poison cannot be harmful to the city of London because toxins are usually produced at warm temperatures. Also the water temperatures were mostly low in our locations except Green Park where the temperature was slightly higher than other places. This place has a higher risk of having toxins from Penelope Poison as compared to other locations we have been to. The wind speed in most of the areas that we went to was minimal therefore those areas have a low risk of getting toxins from Penelope Poison. St James Park had a higher wind speed as compared to the other areas we went to therefore the risk of having toxins from Penelope Poison are slightly higher in this place than other areas. | ||
== Error Analysis == | == Error Analysis == | ||
| + | |||
| + | '''GPS -''' The Etrex yellow GPS used to calculate the latitude and longitude of each location may be responsible for several significant sources of error during data collection. We noted that in locations such as Trafalgar square, where there were a number of tall buildings, signal reflection may have caused the information being sent to the receiver to be delayed contributing to further inaccuracy. Although the data obtained in very open locations such as parks were unlikely to be affected by a signal reflection, it is possible that interference with accurate data is attributable to a clock error within the GPS. If the clock inside the GPS was in fact not the same as the clocks of the satellites, this may have resulted in incorrect calculations. However, it was indicated by the system that all values obtained were within the range of +/- 3 metres. At 51 degrees latitude and thirty minutes, the length of one degree latitude is 111,258 metres. This means that the possible error is minimal ( +/- 0.000027 degrees). The length of a degree longitude is 69,440 and again the air is minimal ( +/- 0.000043 degrees). | ||
| + | |||
| + | '''Wind direction/Compass -''' We calculated the degree of human error in using the compass as well as a cigarette lighter to be +/- 5 degrees. It is possible that because three different persons were chosen to read the compass, the angle at which it was being held may not have been completely flat, and estimations may have been incorrect based on different strengths in vision. Also, in using a lighter to determine the general direction of the wind we noticed that at several times the direction of the wind changed. We attributed this to that fact that trees other obstructions may have caused the wind to shift its direction and noted it as a significant source of error. | ||
| + | |||
| + | '''Beaufort Scale -''' Our reliance on the Beaufort Scale to determine wind speed made our data collection especially sensitive to error. Although there was an intentional lack of discussion among the three group members chosen to use the scale at the different locations, there was a certain homogeneity of results as these members revealed their choices. Furthermore, no matter how basic the descriptions of the scale were, the data became relative to each individuals interpretation of these groupings | ||
| + | |||
| + | '''Mini Infrared thermometer (fluke-62) -''' A mini infrared thermometer (fluke-62) was used to calculate the air and water temperature at the various locations. Sources of error were expected to be minimal because of a consistency in measuring the temperature of same spot at each of these locations. It was discovered after data collection that our decision to point the thermometer to the sky to obtain a temperature may have contributed to incorrect readings. It would have been possible to reduce errors associated with this by aiming the thermometer a leaf at the different sites. Despite taking multiple readings and obtaining very similar numbers we note that the margin of error for the thermometer is +/- 4 degrees Celsius. | ||
== Images == | == Images == | ||
| Line 135: | Line 145: | ||
| − | + | [[Image:green-a.jpg|center|thumb|Green Team's photograph of Location A]] | |
'''Location B''' | '''Location B''' | ||
| − | [[Image:loc-b.jpg|center| | + | [[Image:loc-b.jpg|center|thumb|Dr. Obfuscation's photograph of Location B]] |
| + | |||
| − | + | [[Image:green-b.jpg|center|thumb|Green Team's photograph of Location B]] | |
'''Location C''' | '''Location C''' | ||
| − | + | [[Image:loc-c.jpg|center|thumb|Dr. Obfuscation's photograph of Location C]] | |
| − | + | ||
| + | [[Image:green-c.jpg|center|thumb|Green Team's photograph of Location C]] | ||
'''Location D''' | '''Location D''' | ||
| − | [[Image:loc-d.jpg|center| | + | [[Image:loc-d.jpg|center|thumb|Dr. Obfuscation's photograph of Location D]] |
| − | + | [[Image:green-d.jpg|center|thumb|Green Team's photograph of Location D]] | |
'''Location E''' | '''Location E''' | ||
| − | [[Image:loc-e.jpg|center| | + | [[Image:loc-e.jpg|center|thumb|Dr. Obfuscation's photograph of Location E]] |
| − | + | ||
| + | [[Image:green-e.jpg|center|thumb|Green Team's photograph of Location E]] | ||
'''Location F''' | '''Location F''' | ||
| − | [[Image:loc-f.jpg|center| | + | [[Image:loc-f.jpg|center|thumb|Dr. Obfuscation's photograph of Location F]] |
| − | + | ||
| + | [[Image:green-f.jpg|center|thumb|Green Team's photograph of Location F]] | ||
'''Location G''' | '''Location G''' | ||
| − | [[Image:loc-g.jpg|center| | + | [[Image:loc-g.jpg|center|thumb|Dr. Obfuscation's photograph of Location G]] |
| − | + | ||
| + | [[Image:green-g.jpg|center|thumb|Green Team's photograph of Location G]] | ||
'''Location H''' | '''Location H''' | ||
| − | [[Image:loc-h.jpg|center| | + | [[Image:loc-h.jpg|center|thumb|Dr. Obfuscation's photograph of Location H]] |
| − | + | ||
| + | [[Image:green-h.jpg|center|thumb|Green Team's photograph of Location H]] | ||
'''Location I''' | '''Location I''' | ||
| − | [[Image:loc-i.jpg|center| | + | [[Image:loc-i.jpg|center|thumb|Dr. Obfuscation's photograph of Location I]] |
| − | + | ||
| + | [[Image:green-i.jpg|center|thumb|Green Team's photograph of Location I]] | ||
'''Location J''' | '''Location J''' | ||
| − | [[Image:loc-j.jpg|center| | + | [[Image:loc-j.jpg|center|thumb|Dr. Obfuscation's photograph of Location J]] |
| − | + | [[Image:green-j.jpg|center|thumb|Green Team's photograph of Location J]] | |
'''Location K''' | '''Location K''' | ||
| − | [[Image:loc-k.jpg|center| | + | [[Image:loc-k.jpg|center|thumb|Dr. Obfuscation's photograph of Location K]] |
| − | + | ||
| + | [[Image:green-k.jpg|center|thumb|Green Team's photograph of Location K]] | ||
== Appendix A: Raw Data == | == Appendix A: Raw Data == | ||
| Line 381: | Line 399: | ||
== Appendix B: Visualization == | == Appendix B: Visualization == | ||
| − | |||
| − | + | [[Image:graph1.jpg|center|thumb]] | |
| + | |||
| + | |||
| + | [[Image:graph2.jpg|center|thumb]] | ||
| + | |||
VISUALIZATION WORK | VISUALIZATION WORK | ||
| Line 440: | Line 461: | ||
== Appendix C: Who Did What == | == Appendix C: Who Did What == | ||
| − | '''Spencer''' ~ During the lab I was responsible for recording the data as well as providing one of the three readings for both wind direction and wind speed. Because I downloaded the pictures onto my computer before the lab, and was able to identify | + | '''Spencer''' ~ During the lab I was responsible for recording the data as well as providing one of the three readings for both wind direction and wind speed. Because I downloaded the pictures onto my computer before the lab, and was able to identify the geo-coding with iPhoto, I wrote the "Problem Description and Approach". After McKayla calculated the measurements and entered the raw data onto the wiki, I edited it with the proper notations. I also created the table with all of our measurements and made sure the photographs and visualizations were properly embedded. |
'''Johanna''' ~ During the lab I used the GPS unit to take readings for latitude, longitude, and elevation, as well as helping determine wind direction with the lighter. I wrote the data collection section of the lab write-up. | '''Johanna''' ~ During the lab I used the GPS unit to take readings for latitude, longitude, and elevation, as well as helping determine wind direction with the lighter. I wrote the data collection section of the lab write-up. | ||
| + | |||
| + | '''McKayla''' ~ During the lab I took readings for air and water temperatures at each locations. I also was responsible for taking the Green Team's photographs at each location. I created the visualizations for the data on the lab write-up. | ||
| + | |||
| + | '''Krystnell''' ~ During the lab I was one of the three members responsible for giving a reading for both wind direction and wind speed. In the lab write-up I took care of the sections concerning the sources of error. | ||
| + | |||
| + | '''Gillian''' ~ During the lab I also took the readings of the wind direction and wind speed along with two other people. I also did the second part of the data analysis section. | ||
Latest revision as of 09:41, 27 February 2011
Lab 2: Holy Pigeon P$#! Batman, it's Penelope Poison!
Green: Krystnell, Johanna, Spencer, McKayla, Gillian
Problem Description and Approach
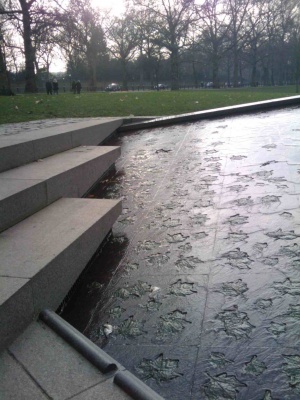
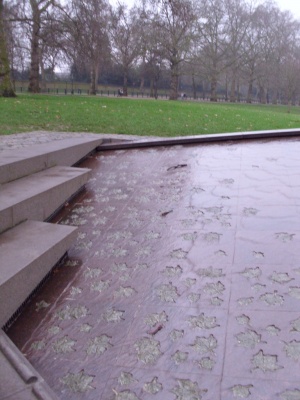
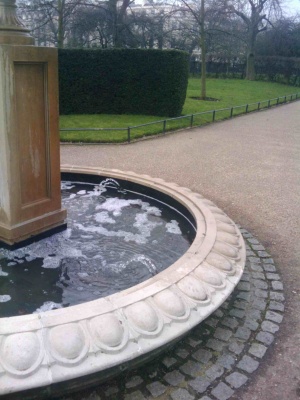
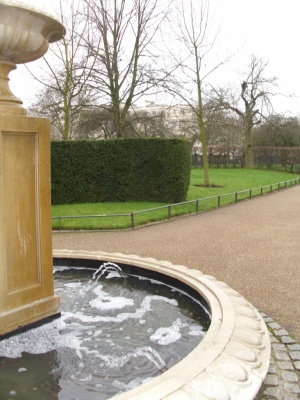
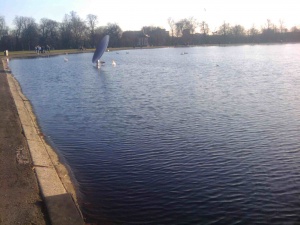
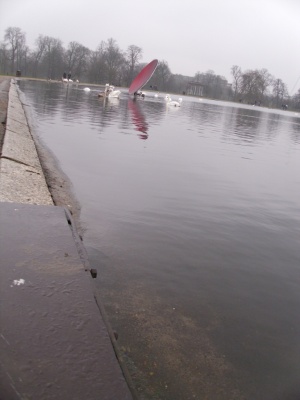
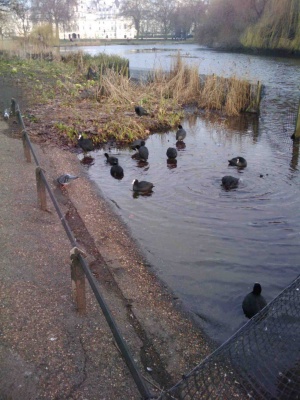
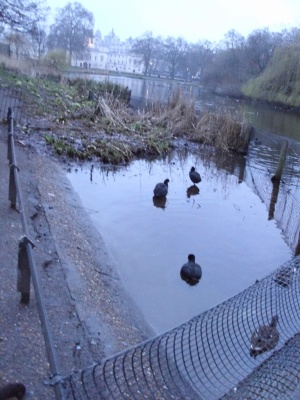
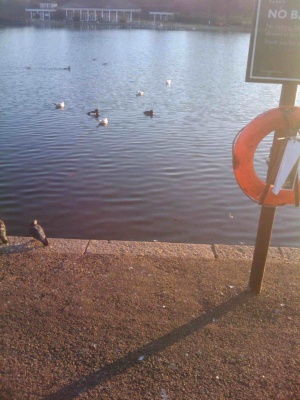
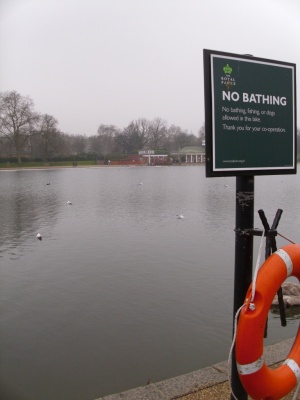
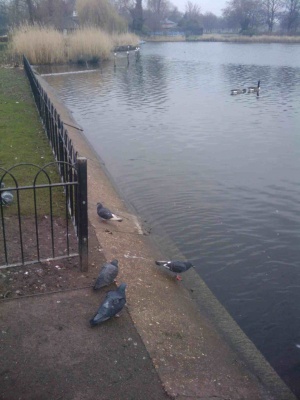
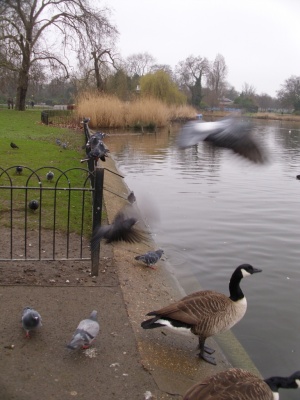
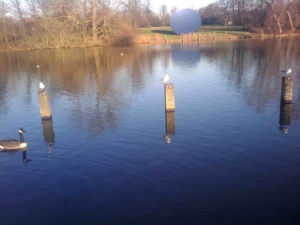
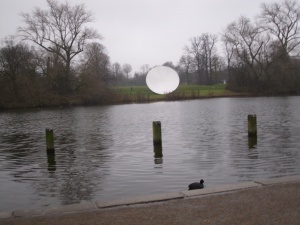
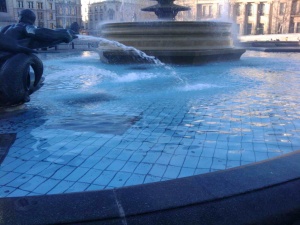
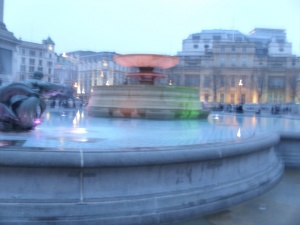
For this lab, Dr. Obsfucation sent out eleven photographs of various bodies of water around central London. He informed us that Penelope Poison was threatening to release toxic substances at each location; he asked the Green Team to find each location using the photographs and take several readings at each location: longitude, latitude, elevation, wind direction, wind speed, water temperature, and air temperature. More importantly, for every reading it was necessary that we take three readings in order to make an accurate measurement.
Our initial approach dealt with using the geo-coding of each photograph to identify the longitude and latitude and then map out the locations. The photos were downloaded and imported into iPhoto, where the "Places" application created a map of the locations. With a time element involved, we decided to head towards Regents Park first, where two photographs were taken, and make our way back to Trafalgar Square, via Hyde Park and then Green Park / St. James Park. The methodology for the collection of necessary data is explained below.
Data Collection
In order to measure the latitude, longitude, and elevation of each site, we took three separate readings using a yellow Etrex GPS unit. At each location, we turned on the unit, waited for it to locate the satellites, and recorded the first set of readings. Then we moved the GPS unit away from the location and back to cause the GPS to take a new reading from the satellites. We recorded this second set of raw data and then moved the GPS a second time to for a final set of readings.
In order to determine wind direction, three group members took turns using a cigarette lighter at the location to determine the direction of the breeze, faced in that direction, and then took an angle reading using the compass. All three readings were recorded. In order to determine wind speed, different group members used the Beaufort scale to estimate a speed without consulting each other, and recorded their decision.
To determine water temperature, we pointed the Mini Infared Thermometer Fluke-62 at the body of water pictured in each photograph, recorded the temperature reading, and repeated this process two more times to come up with three readings. To determine the temperature of the air, we pointed the infared thermometer at the sky, pressed the button to take a reading, and repeated this two more times to produce three readings.
Data Analysis
| Location A | Location B | Location C | Location D | Location E | Location F | Location G | Location H | Location I | Location J | Location K | |
|---|---|---|---|---|---|---|---|---|---|---|---|
| Longitude | 51° 30.177' | 51° 31.522' | 51° 30.382' | 51° 30.209' | 51° 30.355' | 51° 31.699' | 51° 30.446' | 51° 30.492' | 51° 30.265' | 51° 30.107' | 51° 30.641' |
| Latitude | 0° 8.554' | 0° 8.852' | 0° 10.915' | 0° 7.917' | 0° 10.094' | 0° 9.652' | 0° 10.492' | 0° 7.651' | 0° 9.604' | 0° 8.326' | 0° 10.552' |
| Elevation | 3 m | 35 m | 22.6 m | (-)3.6 m | 14 m | 30 m | 13.6 m | 5.6 m | 14.6 m | 3 m | 16.3 m |
| Wind Direction | 258.3° | 203.3° | 243.3° | 323.3° | 165° | 238.3° | 250° | 48.3° | 286.6° | 32.6° | 223.3° |
| Wind Speed | 2 mph | 3.6 mph | 3 mph | 5.3 mph | 4 mph | 4.6 mph | 2 mph | 2.6 mph | 2.3 mph | 1.6 mph | 2 mph |
| Water Temperature | 43.16°F | 39.16°F | 39.16°F | 39.83°F | 39°F | 38.3°F | 39.83°F | 38.3°F | 39.6°F | 39.83°F | 38.83°F |
| Air Temperature | 32.3°F | 35.16°F | 33.16°F | 32.16°F | 32.6°F | 32.16°F | 34.5°F | 32.83°F | 33.6°F | 31.83°F | 34.6°F |
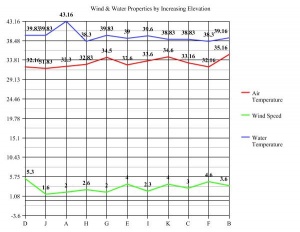
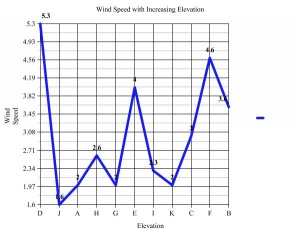
The air temperatures between our locations did not vary much they were all low temperatures with a range of 31°F-34°F. Due to this Penelope Poison cannot be harmful to the city of London because toxins are usually produced at warm temperatures. Also the water temperatures were mostly low in our locations except Green Park where the temperature was slightly higher than other places. This place has a higher risk of having toxins from Penelope Poison as compared to other locations we have been to. The wind speed in most of the areas that we went to was minimal therefore those areas have a low risk of getting toxins from Penelope Poison. St James Park had a higher wind speed as compared to the other areas we went to therefore the risk of having toxins from Penelope Poison are slightly higher in this place than other areas.
Error Analysis
GPS - The Etrex yellow GPS used to calculate the latitude and longitude of each location may be responsible for several significant sources of error during data collection. We noted that in locations such as Trafalgar square, where there were a number of tall buildings, signal reflection may have caused the information being sent to the receiver to be delayed contributing to further inaccuracy. Although the data obtained in very open locations such as parks were unlikely to be affected by a signal reflection, it is possible that interference with accurate data is attributable to a clock error within the GPS. If the clock inside the GPS was in fact not the same as the clocks of the satellites, this may have resulted in incorrect calculations. However, it was indicated by the system that all values obtained were within the range of +/- 3 metres. At 51 degrees latitude and thirty minutes, the length of one degree latitude is 111,258 metres. This means that the possible error is minimal ( +/- 0.000027 degrees). The length of a degree longitude is 69,440 and again the air is minimal ( +/- 0.000043 degrees).
Wind direction/Compass - We calculated the degree of human error in using the compass as well as a cigarette lighter to be +/- 5 degrees. It is possible that because three different persons were chosen to read the compass, the angle at which it was being held may not have been completely flat, and estimations may have been incorrect based on different strengths in vision. Also, in using a lighter to determine the general direction of the wind we noticed that at several times the direction of the wind changed. We attributed this to that fact that trees other obstructions may have caused the wind to shift its direction and noted it as a significant source of error.
Beaufort Scale - Our reliance on the Beaufort Scale to determine wind speed made our data collection especially sensitive to error. Although there was an intentional lack of discussion among the three group members chosen to use the scale at the different locations, there was a certain homogeneity of results as these members revealed their choices. Furthermore, no matter how basic the descriptions of the scale were, the data became relative to each individuals interpretation of these groupings
Mini Infrared thermometer (fluke-62) - A mini infrared thermometer (fluke-62) was used to calculate the air and water temperature at the various locations. Sources of error were expected to be minimal because of a consistency in measuring the temperature of same spot at each of these locations. It was discovered after data collection that our decision to point the thermometer to the sky to obtain a temperature may have contributed to incorrect readings. It would have been possible to reduce errors associated with this by aiming the thermometer a leaf at the different sites. Despite taking multiple readings and obtaining very similar numbers we note that the margin of error for the thermometer is +/- 4 degrees Celsius.
Images
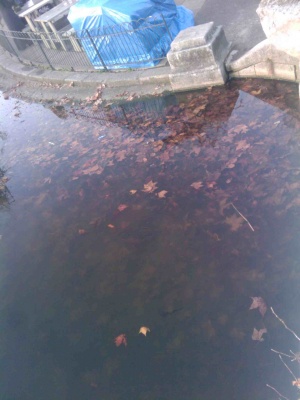
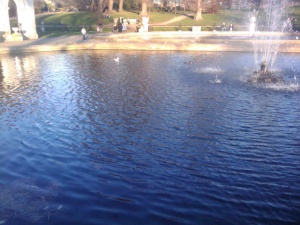
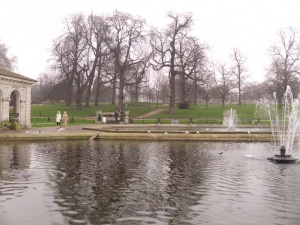
Location A
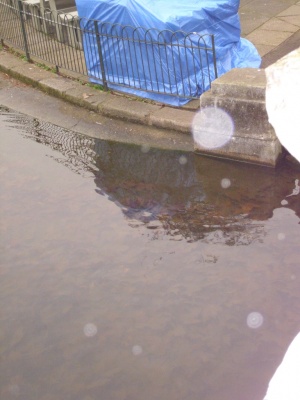
Location B
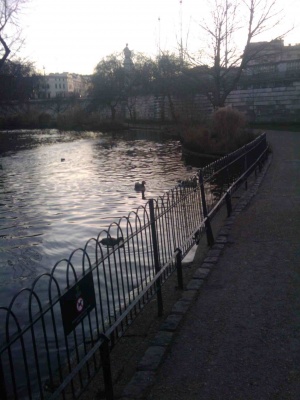
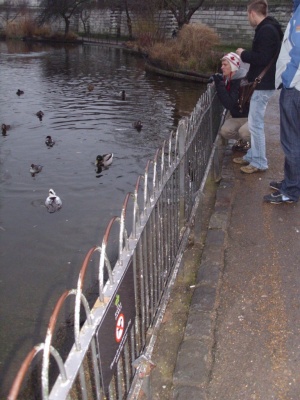
Location C
Location D
Location E
Location F
Location G
Location H
Location I
Location J
Location K
Appendix A: Raw Data
Note: The last reading is the average of all three readings.
Location A
Lat – 51° 30.178’ ; 51° 30.177’ ; 51° 30.177’ ---- 51° 30.177'
Long – 0° 8.553’ ; 0° 8.556’ ; 0° 8.554’ ---- 0° 8.554'
Elv – 2 m ; 3 m ; 4 m ---- 3 m
Wind Direction – 260° ; 255° ; 260° ---- 258.3°
Wind speed – 1 (1 mph) ; 1 (2 mph) ; 1 (3 mph)---- 2 mph
Water Temp – 43°F ; 43°F ; 43.5°F ---- 43.16°F
Air Temp – 32°F ; 32.5°F ; 32.5°F ---- 32.3°F
Location B
Lat – 51° 31.521’ ; 51° 31.522’ ; 51° 31.523’ ---- 51° 31.522'
Long – 0° 8.852’ ; 0° 8.851’ ; 0° 8.852’ ---- 0° 8.852'
Elv – 36 m ; 34m ; 35 m ---- 35 m
Wind Direction – 210° ; 200° ; 200° ---- 203.3°
Wind speed – 2 (5 mph) ; 2 (4 mph) ; 1 (2 mph)---- 3.6 mph
Water Temp – 40°F ; 39°F ; 38.5°F ---- 39.16°F
Air Temp – 38°F ; 35°F ; 32.5°F ---- 35.16°F
Location C
Lat – 51° 30.383’ ; 51° 30.382’ ; 51° 30.382’ ---- 51° 30.382'
Long – 0° 10.914’ ; 0° 10.915’ ; 0° 10.915’ ---- 0° 10.915'
Elv – 22 m ; 22 m ; 24 m ---- 22.6 m
Wind Direction – 240° ; 245° ; 245° ---- 243.3°
Wind speed – 1 (2mph) ; 1 (3 mph) ; 2 (4 mph) ---- 3 mph
Water Temp – 39°F ; 39°F ; 38.5°F ---- 39.16°F
Air Temp – 33°F ; 33°F ; 33.5°F ---- 33.16°F
Location D
Lat – 51° 30.208’ ; 51° 30.208’ ; 51° 30.210’ ---- 51° 30.209'
Long – 0° 7.915’ ; 0° 7.918’ ; 0° 7.917’ ---- 0° 7.917'
Elv – (-)6 m ; (-)3 m ; (-)2 m ---- (-)3.6 m
Wind Direction – 320° ; 330° ; 320° ---- 323.3°
Wind speed – 2 (6 mph) ; 2 (5 mph) ; 2 (5 mph) ---- 5.3 mph
Water Temp – 40°F ; 40°F ; 39.5°F ---- 39.83°F
Air Temp – 32.5°F ; 32°F ; 32°F ---- 32.16°F
Location E
Lat – 51° 30.354’ ; 51° 30.356’ ; 51° 30.354’ ---- 51° 30.355'
Long – 0° 10.091’ ; 0° 10.091’ ; 0° 10.101’ ---- 0° 10.094'
Elv – 13 m ; 16 m ; 13 m ---- 14 m
Wind Direction – 160° ; 170° ; 165° ---- 165°
Wind speed – 2 (4 mph) ; 1 (3 mph) ; 2 (5 mph) ---- 4 mph
Water Temp – 40°F ; 38.5°F ; 38.5°F ---- 39°F
Air Temp – 32.5°F ; 32.5°F ; 33°F ---- 32.6°F
Location F
Lat – 51° 31.669’ ; 51° 31.669’ ; 51° 31.668’ ---- 51° 31.699'
Long – 0° 9.652’ ; 0° 9.652’ ; 0° 9.651’ ---- 0° 9.652'
Elv – 31 m ; 31 m ; 28 m ---- 30 m
Wind Direction – 240° ; 245° ; 230° ---- 238.3°
Wind speed – 2 (5 mph) ; 2 (4 mph) ; 2 (5 mph) ---- 4.6 mph
Water Temp – 38.5°F ; 38.5°F ; 38°F ---- 38.3°F
Air Temp – 32°F ; 32°F ; 32.5°F ---- 32.16°F
Location G
Lat – 51° 30.446’ ; 51° 30.445’ ; 51° 30.446’ ---- 51° 30.446'
Long – 0° 10.492’ ; 0° 10.492’ ; 0° 10.491’ ---- 0° 10.492'
Elv – 13 m ; 14 m ; 14 m ---- 13.6 m
Wind Direction – 260° ; 240° ; 250° ---- 250°
Wind speed – 1 (2 mph) ; 1 (2 mph) ; 1 (2 mph) ---- 2 mph
Water Temp – 39.5°F ; 40°F ; 40°F ---- 39.83°F
Air Temp – 34.5°F ; 34.5°F ; 34.5°F ---- 34.5°F
Location H
Lat – 51° 30.492’ ; 51° 30.492’ ; 51° 30.491’ ---- 51° 30.492'
Long – 0° 7.650’ ; 0° 7.651’ ; 0° 7.651’ ---- 0° 7.651'
Elv – 6 m ; 5 m ; 6 m ---- 5.6 m
Wind Direction – 40° ; 50° ; 55° ---- 48.3°
Wind speed – 1 (3mph) ; 1 (3 mph) ; 1 (2mph) ---- 2.6 mph
Water Temp – 38.5°F ; 38°F ; 38.5°F ---- 38.3°F
Air Temp – 33°F ; 32.5°F ; 33°F ---- 32.83°F
Location I
Lat – 51° 30.265’ ; 51° 30.264’ ; 51° 30.265’ ---- 51° 30.265'
Long – 0° 9.604’ ; 0° 9.604’ ; 0° 9.604’ ---- 0° 9.604'
Elv – 13 m ; 16 m ; 15 m ---- 14.6 m
Wind Direction – 300° ; 280° ; 280° ---- 286.6°
Wind speed – 1 (3 mph) ; 1 (2 mph) ; 1 (2 mph) ---- 2.3 mph
Water Temp – 39.5°F ; 39.5°F ; 40°F ---- 39.6°F
Air Temp – 33.5°F ; 33.5°F ; 34°F ---- 33.6°F
Location J
Lat – 51° 30.108’ ; 51° 30.106’ ; 51° 30.106’ ---- 51° 30.107'
Long – 0° 8.326’ ; 0° 8.326’ ; 0° 8.325’ ---- 0° 8.326'
Elv – 2 m ; 3 m ; 4 m ---- 3 m
Wind Direction – 30° ; 33° ; 35° ---- 32.6°
Wind speed – 1 (2 mph) ; 1 (1 mph) ; 1 (2 mph) ---- 1.6 mph
Water Temp – 40°F ; 40°F ; 39.5°F ---- 39.83°F
Air Temp – 31.5°F ; 32°F ; 32°F ---- 31.83°F
Location K
Lat – 51° 30.643’ ; 51° 30.639’ ; 51° 30.641’ ---- 51° 30.641'
Long – 0° 10.551’ ; 0° 10.551’ ; 0° 10.554’ ---- 0° 10.552'
Elv – 17 m ; 15 m ; 17 m ---- 16.3 m
Wind Direction – 220° ; 220° ; 230° ---- 223.3°
Wind speed – 1 (2 mph) ; 1 (3 mph) ; 1 (1 mph) ---- 2 mph
Water Temp – 39°F ; 38.5°F ; 39°F ---- 38.83°F
Air Temp – 34.5°F ; 35°F ; 34.5°F ---- 34.6°F
Appendix B: Visualization
VISUALIZATION WORK
RANGES:
Elevation (-) 3.6m (to) 35m
Wind Direction 32.6 (to) 323.3
Wind Speed 1.6 (to) 5.3
Water Temperature 38.3 (to) 43.16
Air Temperature 31.83 (to) 35.16
Locations from Low Elevation to High Elevation
1) D - (-) 3.6m
2) J - 3m
3) A - 3m
4) H - 5.6m
5) G - 13.6m
6) E - 14m
7) I - 14.6m
8) K - 16.3 m
9) C - 22.6m
10) F - 30m
11) B - 35m
Wind Direction Values in order of location numbers (in degrees):
323.3, 32.6, 258.3, 48.3, 250, 165, 286.6, 223.3, 243.3, 238.3, 203.3
Wind Speed Values in order of location numbers (in miles per hour):
5.3, 1.6, 2, 2.6, 2, 4, 2.3, 2, 3, 4.6, 3.6
Water Temperature Values in order of location numbers (in degrees Fahrenheit):
39.83, 39.83, 43.16, 38.3, 39.83, 39, 39.6, 38.83, 38.83, 38.3, 39.16
Air Temperature Values in order of location numbers (in degrees Fahrenheit) :
32.16, 31.83, 32.3, 32.83, 34.5, 32.6, 33.6, 34.6, 33.16, 32.16, 35.16
Appendix C: Who Did What
Spencer ~ During the lab I was responsible for recording the data as well as providing one of the three readings for both wind direction and wind speed. Because I downloaded the pictures onto my computer before the lab, and was able to identify the geo-coding with iPhoto, I wrote the "Problem Description and Approach". After McKayla calculated the measurements and entered the raw data onto the wiki, I edited it with the proper notations. I also created the table with all of our measurements and made sure the photographs and visualizations were properly embedded.
Johanna ~ During the lab I used the GPS unit to take readings for latitude, longitude, and elevation, as well as helping determine wind direction with the lighter. I wrote the data collection section of the lab write-up.
McKayla ~ During the lab I took readings for air and water temperatures at each locations. I also was responsible for taking the Green Team's photographs at each location. I created the visualizations for the data on the lab write-up.
Krystnell ~ During the lab I was one of the three members responsible for giving a reading for both wind direction and wind speed. In the lab write-up I took care of the sections concerning the sources of error.
Gillian ~ During the lab I also took the readings of the wind direction and wind speed along with two other people. I also did the second part of the data analysis section.
