Difference between revisions of "Student-solutions/Ryan"
Jump to navigation
Jump to search
| (6 intermediate revisions by the same user not shown) | |||
| Line 1: | Line 1: | ||
| + | == Gnuplot Visualization v2.0== | ||
| + | <pre> | ||
| + | set multiplot layout 1,2 columnsfirst title "Greenhouse Gas Emissions of United States (1990-2005)\nData courtesy of The World Bank" | ||
| + | set xtics 1990,5,2005 | ||
| + | set ylabel "Thousand metric tons of CO2 equivalents" | ||
| + | set key off | ||
| + | plot "stats.txt" using 1:2 title "CO2" with lp pt 7, "stats.txt" using 1:3 title "CH4" with lp pt 7, "stats.txt" using 1:4 title "N2O" with lp pt 7, "stats.txt" using 1:5 title "HFC, PFC, SF6" with lp pt 7, "stats.txt" using 1:(sum [col=2:7] column(col)) title "Total" with lp pt 7 | ||
| + | set ylabel "Percent change since 1990" | ||
| + | set key outside bottom horizontal spacing 0.75 | ||
| + | plot "stats.txt" using 1:6 title "CO2" with lp pt 7, "stats.txt" using 1:7 title "CH4" with lp pt 7, "stats.txt" using 1:8 title "N2O" with lp pt 7, "stats.txt" using 1:9 title "HFC, PFC, SF6" with lp pt 7, "stats.txt" using 1:10 title "Total" with lp pt 7 | ||
| + | unset multiplot | ||
| + | #End | ||
| + | </pre> | ||
| + | |||
| + | == Gnuplot Visualization == | ||
| + | <pre> | ||
| + | set multiplot layout 1,2 columnsfirst title "Greenhouse Gas Emissions of United States (1990-2005)\nData courtesy of The World Bank" | ||
| + | set xtics 1990,5,2005 | ||
| + | set ylabel "Thousand metric tons of CO2 equivalents" | ||
| + | set key inside right center | ||
| + | plot "stats.txt" using 1:2 title "Carbon Dioxide (CO2)" with lp pt 7, "stats.txt" using 1:3 title "Methane (CH4)" with lp pt 7, "stats.txt" using 1:4 title "Nitrous Oxide (N2O)" with lp pt 7, "stats.txt" using 1:5 title "Other (HFC, PFC, SF6)" with lp pt 7, "stats.txt" using 1:(sum [col=2:7] column(col)) title "Total" with lp pt 7 | ||
| + | set ylabel "Percent change since 1990" | ||
| + | set key inside left top | ||
| + | plot "stats.txt" using 1:6 title "Carbon Dioxide (CO2)" with lp pt 7, "stats.txt" using 1:7 title "Methane (CH4)" with lp pt 7, "stats.txt" using 1:8 title "Nitrous Oxide (N2O)" with lp pt 7, "stats.txt" using 1:9 title "Other (HFC, PFC, SF6)" with lp pt 7, "stats.txt" using 1:10 title "Total" with lp pt 7 | ||
| + | unset multiplot | ||
| + | #End | ||
| + | </pre> | ||
| + | |||
| + | == Science Visualizations == | ||
| + | [[File:science-vis-1-ryan.jpg|500px]]<br /><br /> | ||
| + | [[File:science-vis-2-ryan.png|500px]] | ||
| + | |||
== R Visualization == | == R Visualization == | ||
<pre> | <pre> | ||
Latest revision as of 01:10, 6 November 2012
Contents
Gnuplot Visualization v2.0
set multiplot layout 1,2 columnsfirst title "Greenhouse Gas Emissions of United States (1990-2005)\nData courtesy of The World Bank"
set xtics 1990,5,2005
set ylabel "Thousand metric tons of CO2 equivalents"
set key off
plot "stats.txt" using 1:2 title "CO2" with lp pt 7, "stats.txt" using 1:3 title "CH4" with lp pt 7, "stats.txt" using 1:4 title "N2O" with lp pt 7, "stats.txt" using 1:5 title "HFC, PFC, SF6" with lp pt 7, "stats.txt" using 1:(sum [col=2:7] column(col)) title "Total" with lp pt 7
set ylabel "Percent change since 1990"
set key outside bottom horizontal spacing 0.75
plot "stats.txt" using 1:6 title "CO2" with lp pt 7, "stats.txt" using 1:7 title "CH4" with lp pt 7, "stats.txt" using 1:8 title "N2O" with lp pt 7, "stats.txt" using 1:9 title "HFC, PFC, SF6" with lp pt 7, "stats.txt" using 1:10 title "Total" with lp pt 7
unset multiplot
#End
Gnuplot Visualization
set multiplot layout 1,2 columnsfirst title "Greenhouse Gas Emissions of United States (1990-2005)\nData courtesy of The World Bank"
set xtics 1990,5,2005
set ylabel "Thousand metric tons of CO2 equivalents"
set key inside right center
plot "stats.txt" using 1:2 title "Carbon Dioxide (CO2)" with lp pt 7, "stats.txt" using 1:3 title "Methane (CH4)" with lp pt 7, "stats.txt" using 1:4 title "Nitrous Oxide (N2O)" with lp pt 7, "stats.txt" using 1:5 title "Other (HFC, PFC, SF6)" with lp pt 7, "stats.txt" using 1:(sum [col=2:7] column(col)) title "Total" with lp pt 7
set ylabel "Percent change since 1990"
set key inside left top
plot "stats.txt" using 1:6 title "Carbon Dioxide (CO2)" with lp pt 7, "stats.txt" using 1:7 title "Methane (CH4)" with lp pt 7, "stats.txt" using 1:8 title "Nitrous Oxide (N2O)" with lp pt 7, "stats.txt" using 1:9 title "Other (HFC, PFC, SF6)" with lp pt 7, "stats.txt" using 1:10 title "Total" with lp pt 7
unset multiplot
#End
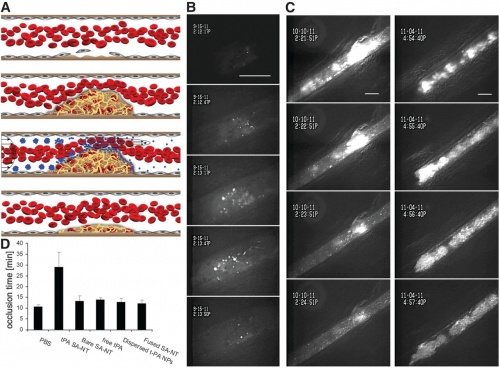
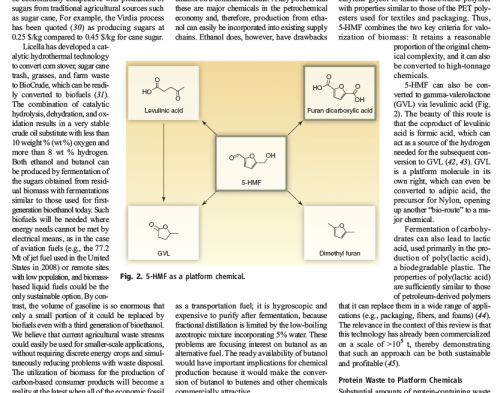
Science Visualizations
R Visualization
time <- c(2*0:10,21)
init <- 1
fin <- 220
i <- init:fin
weight0 <- ifelse(ChickWeight[i,2] == 0, ChickWeight[i,1], NA)
weight2 <- ifelse(ChickWeight[i,2] == 2, ChickWeight[i,1], NA)
weight4 <- ifelse(ChickWeight[i,2] == 4, ChickWeight[i,1], NA)
weight6 <- ifelse(ChickWeight[i,2] == 6, ChickWeight[i,1], NA)
weight8 <- ifelse(ChickWeight[i,2] == 8, ChickWeight[i,1], NA)
weight10 <- ifelse(ChickWeight[i,2] == 10, ChickWeight[i,1], NA)
weight12 <- ifelse(ChickWeight[i,2] == 12, ChickWeight[i,1], NA)
weight14 <- ifelse(ChickWeight[i,2] == 14, ChickWeight[i,1], NA)
weight16 <- ifelse(ChickWeight[i,2] == 16, ChickWeight[i,1], NA)
weight18 <- ifelse(ChickWeight[i,2] == 18, ChickWeight[i,1], NA)
weight20 <- ifelse(ChickWeight[i,2] == 20, ChickWeight[i,1], NA)
weight21 <- ifelse(ChickWeight[i,2] == 21, ChickWeight[i,1], NA)
weights <- array(c(weight0, weight2, weight4, weight6, weight8, weight10, weight12, weight14, weight16, weight18, weight20, weight21), c(fin-init+1, 12))
meanweight <- colMeans(weights, na.rm = TRUE, dims = 1)
plot(time, meanweight, xlim=c(0,21),ylim=c(40,271),main="Mean Chick Weights for Four Diets over Twenty-One Days",type="b")
init <- 221
fin <- 340
i <- init:fin
weight0 <- ifelse(ChickWeight[i,2] == 0, ChickWeight[i,1], NA)
weight2 <- ifelse(ChickWeight[i,2] == 2, ChickWeight[i,1], NA)
weight4 <- ifelse(ChickWeight[i,2] == 4, ChickWeight[i,1], NA)
weight6 <- ifelse(ChickWeight[i,2] == 6, ChickWeight[i,1], NA)
weight8 <- ifelse(ChickWeight[i,2] == 8, ChickWeight[i,1], NA)
weight10 <- ifelse(ChickWeight[i,2] == 10, ChickWeight[i,1], NA)
weight12 <- ifelse(ChickWeight[i,2] == 12, ChickWeight[i,1], NA)
weight14 <- ifelse(ChickWeight[i,2] == 14, ChickWeight[i,1], NA)
weight16 <- ifelse(ChickWeight[i,2] == 16, ChickWeight[i,1], NA)
weight18 <- ifelse(ChickWeight[i,2] == 18, ChickWeight[i,1], NA)
weight20 <- ifelse(ChickWeight[i,2] == 20, ChickWeight[i,1], NA)
weight21 <- ifelse(ChickWeight[i,2] == 21, ChickWeight[i,1], NA)
weights <- array(c(weight0, weight2, weight4, weight6, weight8, weight10, weight12, weight14, weight16, weight18, weight20, weight21), c(fin-init+1, 12))
meanweight <- colMeans(weights, na.rm = TRUE, dims = 1)
points(time, meanweight, pch=2, type="b")
init <- 341
fin <- 460
i <- init:fin
weight0 <- ifelse(ChickWeight[i,2] == 0, ChickWeight[i,1], NA)
weight2 <- ifelse(ChickWeight[i,2] == 2, ChickWeight[i,1], NA)
weight4 <- ifelse(ChickWeight[i,2] == 4, ChickWeight[i,1], NA)
weight6 <- ifelse(ChickWeight[i,2] == 6, ChickWeight[i,1], NA)
weight8 <- ifelse(ChickWeight[i,2] == 8, ChickWeight[i,1], NA)
weight10 <- ifelse(ChickWeight[i,2] == 10, ChickWeight[i,1], NA)
weight12 <- ifelse(ChickWeight[i,2] == 12, ChickWeight[i,1], NA)
weight14 <- ifelse(ChickWeight[i,2] == 14, ChickWeight[i,1], NA)
weight16 <- ifelse(ChickWeight[i,2] == 16, ChickWeight[i,1], NA)
weight18 <- ifelse(ChickWeight[i,2] == 18, ChickWeight[i,1], NA)
weight20 <- ifelse(ChickWeight[i,2] == 20, ChickWeight[i,1], NA)
weight21 <- ifelse(ChickWeight[i,2] == 21, ChickWeight[i,1], NA)
weights <- array(c(weight0, weight2, weight4, weight6, weight8, weight10, weight12, weight14, weight16, weight18, weight20, weight21), c(fin-init+1, 12))
meanweight <- colMeans(weights, na.rm = TRUE, dims = 1)
points(time, meanweight, pch=3, type="b")
init <- 461
fin <- 578
i <- init:fin
weight0 <- ifelse(ChickWeight[i,2] == 0, ChickWeight[i,1], NA)
weight2 <- ifelse(ChickWeight[i,2] == 2, ChickWeight[i,1], NA)
weight4 <- ifelse(ChickWeight[i,2] == 4, ChickWeight[i,1], NA)
weight6 <- ifelse(ChickWeight[i,2] == 6, ChickWeight[i,1], NA)
weight8 <- ifelse(ChickWeight[i,2] == 8, ChickWeight[i,1], NA)
weight10 <- ifelse(ChickWeight[i,2] == 10, ChickWeight[i,1], NA)
weight12 <- ifelse(ChickWeight[i,2] == 12, ChickWeight[i,1], NA)
weight14 <- ifelse(ChickWeight[i,2] == 14, ChickWeight[i,1], NA)
weight16 <- ifelse(ChickWeight[i,2] == 16, ChickWeight[i,1], NA)
weight18 <- ifelse(ChickWeight[i,2] == 18, ChickWeight[i,1], NA)
weight20 <- ifelse(ChickWeight[i,2] == 20, ChickWeight[i,1], NA)
weight21 <- ifelse(ChickWeight[i,2] == 21, ChickWeight[i,1], NA)
weights <- array(c(weight0, weight2, weight4, weight6, weight8, weight10, weight12, weight14, weight16, weight18, weight20, weight21), c(fin-init+1, 12))
meanweight <- colMeans(weights, na.rm = TRUE, dims = 1)
points(time, meanweight, pch=4, type="b")
points(2,250)
points(2,235,pch=2)
points(2,220,pch=3)
points(2,205,pch=4)
text(3.5,250,"Diet 1")
text(3.5,235,"Diet 2")
text(3.5,220,"Diet 3")
text(3.5,205,"Diet 4")
#Finished!

