Wattsup-vs-wattnode
Contents
Equipment Comparison Primary Goal
The WattsUp? power meter is a mobile device designed to easily monitor standard 120 VAC appliances. The WattNode is more conducive to long term power usage monitoring, and can be used with 120 or 240 VAC appliances. We wanted to see how well the usage data collected from these two metering devices matched up in the short term.
Preparing for a 12 Hour Test Run
- Assembling Test Run Elements (June 28th)
- Ingredients
- Computer Power Cable
- Soldering Iron
- Junction Bar
- WattNode Pro w/ 30 volt current transformer
- Digital Display (preprogrammed for kwh)
- Connection Rings
- Spare wire
- Pliers and Dikes and Roach Clips
- Itty-bitty-teeny-weeny-green-flat-head screw driver
- What Happened (on the day in question)
- Recieved detailed insructions from Professor Peck (including emergency CPR procedures)
- Learned to solder on connection rings and the process of tinning.
- Cut open black insulation of power cable and attached current transformer (CT) around black wire facing the line side.
- Chopped power cable in two on the line side of the CT and installed junction bar and spliced in black and white wires to power WattNode.
- Connected digital display to WattNode (see pic below)
- Connected CT to WattNode (using a tinned jumper wire to set up the WattNode for 120 VAC)
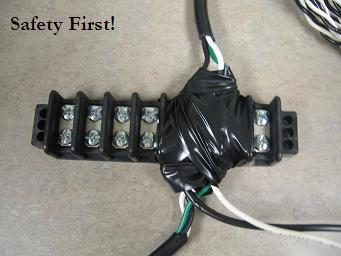
- In a wild move of hyper-safety awareness our very own nervous nelly wrapped large amounts of electrical tape around junction bar.
- Ingredients
The WattNode/WattsUp? Test Run
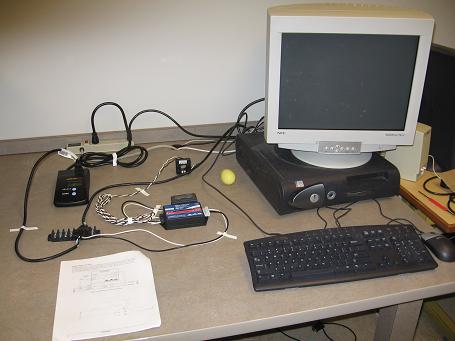
It was a dark and relatively quiet and cool evening on Dennis 4th floor. Colin and Ehren started by plugging the WattsUp? device into the powerstrip and plugging the hacked power cable into the WattsUp? and the computer. By organizing the equipment in series, these two strapping lads were able to see if both devices returned the same result.
http://wiki.cs.earlham.edu/images/a/af/Wattupbefore.JPG
from a mess of wires
http://wiki.cs.earlham.edu/images/9/9c/Wattupafter.JPG
to beauty and perfection
As a service to anyone trying to understand what the heck the setup looked like, this picture was carefully taken:
http://wiki.cs.earlham.edu/images/7/79/Wattupsetup.JPG
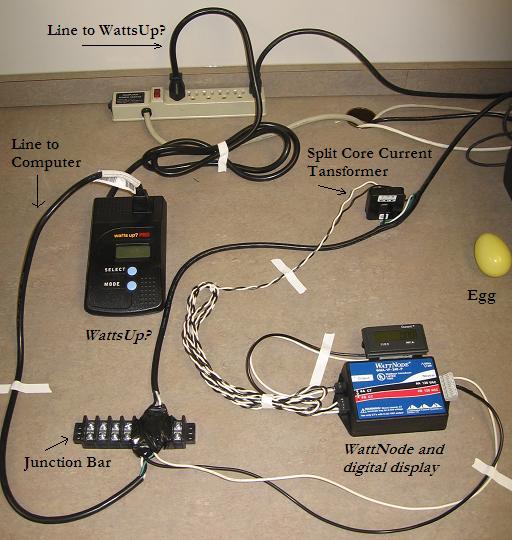
Junction Bar this was placed on the line side of the Wattnode setup. The line was cut and strung up with wires to the Watt node power section patched in. Our resident person-less-convinced-of-their-invulnerability wrapped it up in tape.
WattsUp? basically fulfills the purpose of the Wattnode in a much prettier package. It lacks the ability to patch into a line without a plug such as a water heater, so our Wattnode will be used mainly in that application.
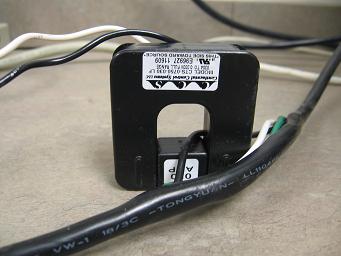
Transformer the transformer is a magnet loop that induces the amount of electricity passing through it. This induction is then measured by the wattnode. It's clipped onto the black, active line with the stickered face facing the source. The green line is the ground and the white line is the neutral.
WattNode Because the test was conducted on a two-phase cable. The patch in from the junction bar was only the active and neutral cable. The unused third phase (the red/B section) was routed back onto itself with the short line of white cable on the left. The A section was then connected to the inducer and the output section was wired to the display.
strictly for moral(e) purposes.
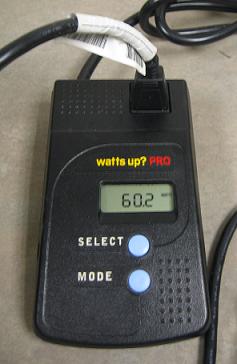
We recorded wattage with CPU idling and at 99% usage (using a summation function in Maple). Idling: 58-60 watts, Max CPU usage: 89-90 watts.
12-Hour Test Results
The WattNode recorded 0.70 kilowatt hours, WattsUp? recorded 707 watt hours. We concluded that the two devices were comprable in the short term.