Difference between revisions of "HIP:Mashup"
Jump to navigation
Jump to search
| Line 25: | Line 25: | ||
* GNUplot which is used to get the graph is installed in all the ACLs and in stewie, and hence you don't have to install to use it.<br> | * GNUplot which is used to get the graph is installed in all the ACLs and in stewie, and hence you don't have to install to use it.<br> | ||
| − | * To make the graph, go to the directory where you have | + | * To make the graph, go to the directory where you have your data file (which will be a csv file if it was generated by EcoWatch).<br> |
| − | *type gnuplot and return, then you will be on gnuplot.<br> | + | *type "gnuplot" and return, then you will be on gnuplot.<br> |
| − | *To plot the data file type 'load "file name"'. | + | *To plot the data file type 'load "file name"' and enter.<br> |
Revision as of 15:35, 2 June 2009
Getting to the final mashup
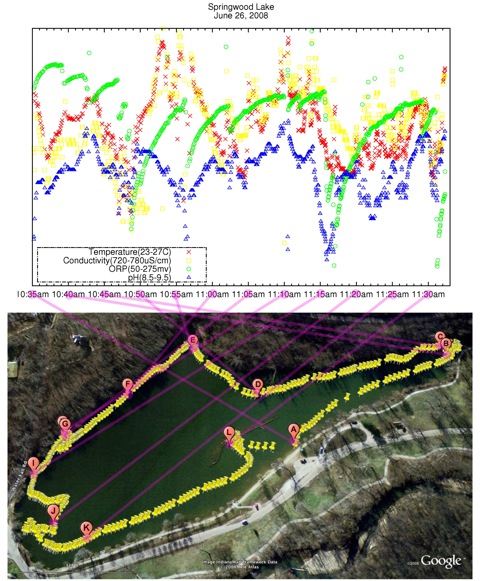
This is an easy step by step procedure for converting data collected by sonde into the YSI 650 MDS and transfered into a computer to the pictures as seen below.
The following is an example of data from sonde, which has been converted to a csv file using EcoWatch.
"Date","Time","Temp","SpCond","Cond","Resistivity","pH","ORP","Longitude","Latitude"
"M/D/Y","hh:mm:ss","C","uS/cm","uS/cm","Ohm.cm","","mV","DD.dddd","DD.dddd"
"05/25/09","11:20:54",23.13,614.0,592.0,1688.4,8.98,145,-84.899391,39.848564
"05/25/09","11:21:04",23.14,616.0,594.0,1682.3,8.97,24,-84.899391,39.848560
"05/25/09","11:21:14",23.16,618.0,596.0,1677.6,8.92,10,-84.899406,39.848568
"05/25/09","11:21:24",23.23,616.0,596.0,1679.0,9.13,-8,-84.899414,39.848614
"05/25/09","11:21:34",23.30,615.0,595.0,1682.0,9.71,-3,-84.899445,39.848648
"05/25/09","11:21:44",23.31,614.0,594.0,1682.8,10.10,7,-84.899544,39.848686
"05/25/09","11:21:54",23.29,614.0,594.0,1683.5,10.28,14,-84.899628,39.848701
"05/25/09","11:22:04",23.21,615.0,594.0,1684.6,10.37,20,-84.899734,39.848736
"05/25/09","11:22:14",23.14,617.0,595.0,1681.2,10.38,24,-84.899818,39.848812
"05/25/09","11:22:24",23.09,617.0,595.0,1680.9,10.41,28,-84.899948,39.848873
"05/25/09","11:22:34",23.01,620.0,596.0,1677.1,10.39,32,-84.900017,39.848980
The final product from the cvs file is presented as the pictures below, which was produced from a combination of google earth, GNUplot and GNU Image Manipulation Program (GIMP).
- GNUplot which is used to get the graph is installed in all the ACLs and in stewie, and hence you don't have to install to use it.
- To make the graph, go to the directory where you have your data file (which will be a csv file if it was generated by EcoWatch).
- type "gnuplot" and return, then you will be on gnuplot.
- To plot the data file type 'load "file name"' and enter.
